Business Capability Map for a Small Service Firm
A framework for finding which business capability actually limits your growth.
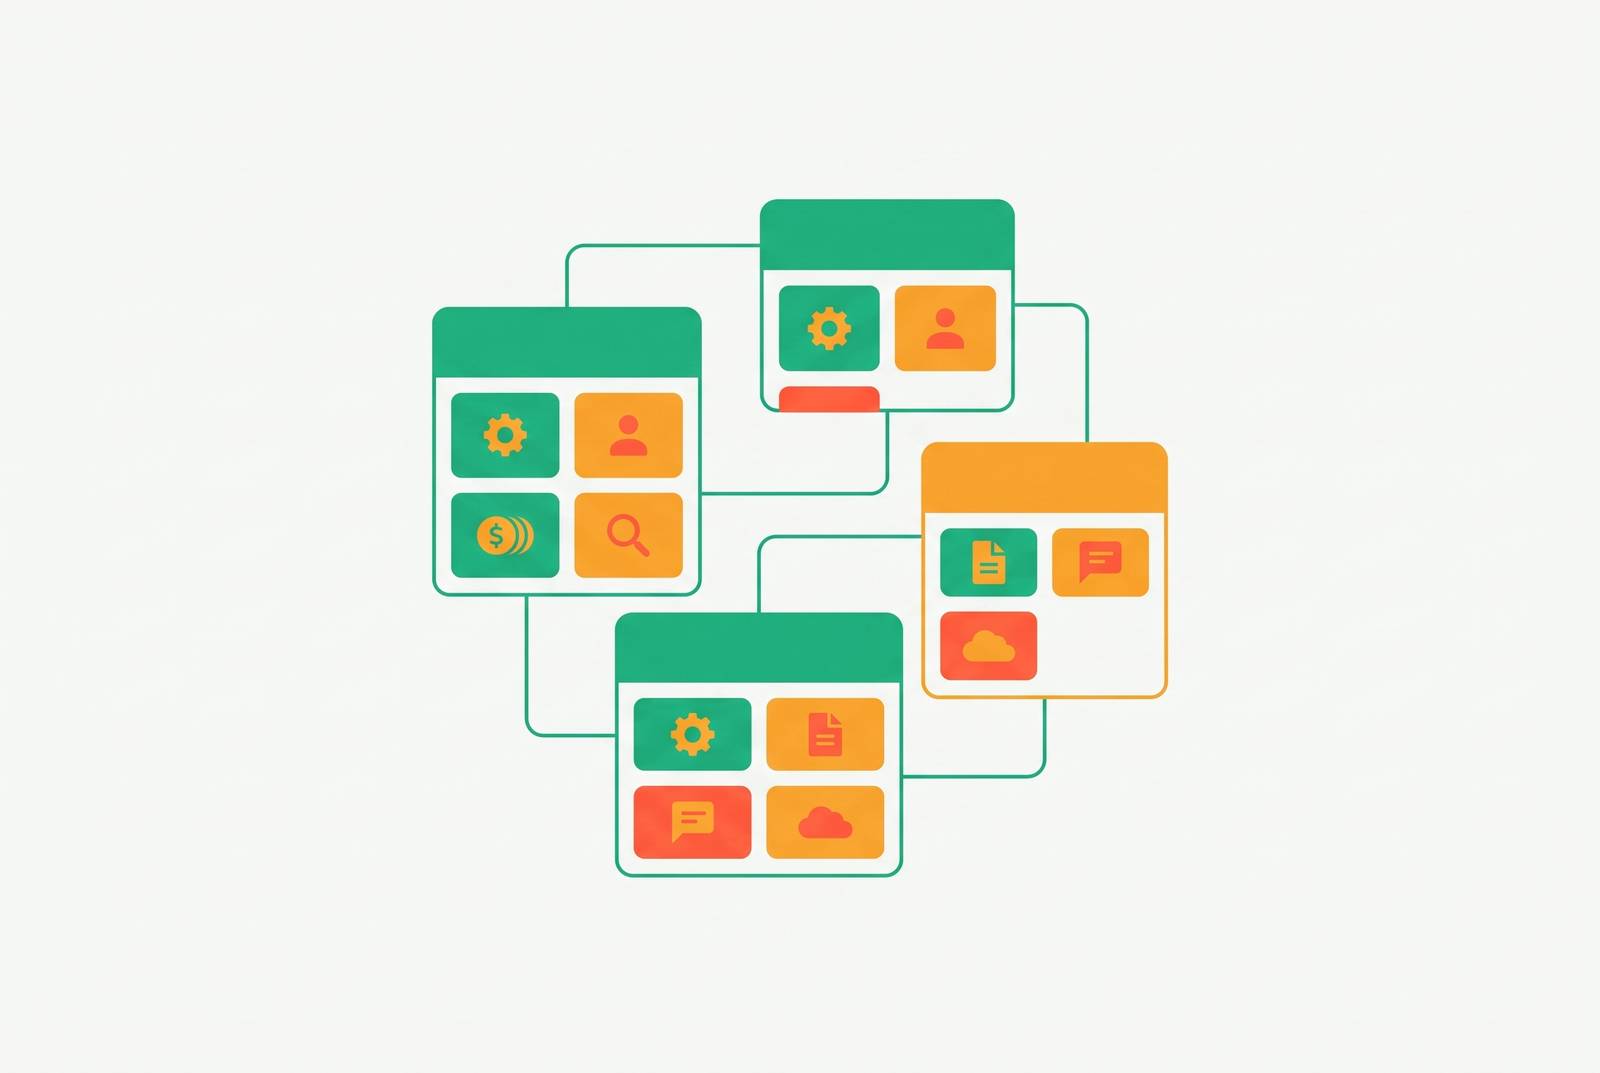
A business capability map answers one question: what must this firm be able to do, regardless of who's doing it or which software they're using? Not "what software runs payroll," not "who handles renewals," but the underlying capability itself, like "Supplier Relationship Management" or "Case Resolution." The map is the stable skeleton that holds steady underneath a business that keeps changing its clothes. Once built, it does something more useful than sit in a slide deck: it lets a small firm find the one capability actually holding growth back, instead of throwing AI tools at whatever's complaining loudest that week.
A capability is not a process, and it's not a job title. Accounts Payable is a capability. The three-step approval workflow in a small business accounting tool is a process. The vendor portal is a piece of software. The AP clerk is a person. Swap out any of those and the capability, "the ability to pay suppliers accurately and on time," survives unchanged. Orbus Software's May 2025 guide calls capabilities "outcome-oriented constructs," which is a mouthful, but the point is simple: capabilities are the thing that stays put while everything else around them gets replaced, reorganized, or automated. That stability is the entire reason the exercise is worth doing. A map of your org chart is obsolete the day someone quits. A map of your capabilities survives the reorg, the new CRM, and the intern who left mid-onboarding.
What the map is not comes up again later when the conversation turns to prioritization: it is not a project plan, not a software inventory, not a headcount chart, and not a to-do list. Those are all downstream of the map. Confuse them with the map itself and you'll end up managing a spreadsheet instead of a strategy.
How the three-tier hierarchy is structured for a small service firm
The standard structure runs three levels deep, though most firms only ever need to live in the first two.
Level 1 covers the big domains: Finance, Sales, Operations, Customer Support, People. These are the departments in spirit, though deliberately not tied to any specific department's current org chart. Level 2 breaks each domain into sub-capabilities: under Sales, that's Pipeline Management, Deal Execution, Renewals; under Support, Case Resolution and Self-Service. Level 3 gets granular, and it's optional: under Lead Management, you might separate Lead Qualification from Lead Assignment, but only if that split earns its keep.
For a small service firm, the canonical Level 1 list usually splits into customer-facing and supporting streams. On the customer-facing side: Sales (pipeline, deal execution, renewals, revenue operations), Marketing (brand, demand generation, channels), and Customer Support (multi-channel engagement, case resolution, self-service, and something usually labeled Voice of the Customer). On the supporting side: People Operations, Financial Services, and Platform or Service Operations, depending on whether the firm ships software, hours, or both.
Walk through one example, because the abstraction only clicks when you see it built out. Take Customer Engagement as Level 1. Under it, Level 2 splits into Lead Management, Customer Support, and Account Retention. Under Lead Management specifically, Level 3 might include items like Campaign Tracking, Support Ticket Resolution, and Loyalty Program Management, the kind of granular split that only earns its place when a domain needs real investment scrutiny. Notice none of those Level 3 items name a tool. That's the discipline: capabilities have to stay non-overlapping and technology-agnostic, or the map collapses into a product catalog with extra steps.
Most working conversations happen at Level 2. Level 3 only gets pulled out when a specific domain needs real investment scrutiny, the business equivalent of only opening the hood when the engine light comes on. And the biggest mistake small firms make on a first pass is treating the map like a term paper that needs footnotes. A rough Level 1 and Level 2 map, built in a few days, beats a meticulously footnoted version that takes three months and ships after the strategic decision it was meant to inform has already been made some other way.
Why building the map is harder than it looks, and what shortcuts exist in 2026
The hard part is picking the right altitude. It's picking the right altitude. A capability description has to be abstract enough to survive a tech migration, but concrete enough that the person running that team actually recognizes their own work in it. Get too abstract and everyone nods along at a meeting and then goes back to doing whatever they were already doing. Get too specific and you've just built an expensive process diagram that expires the next time someone buys new software.
Jung and Wienke's case study, presented at the PoEM conference in 2024, found that building a customer-specific capability map takes multiple rounds of alignment, needs company-specific language rather than generic templates, and eats real time even for experienced consultants. For junior consultants, they note, the abstraction itself is the obstacle: it's a genuinely hard skill to describe what a business does without describing how it currently does it.
That gap appears constantly in practice. One executive asks for a service desk upgrade. Another wants a workflow redesign. A third wants to restructure the team. Without a shared capability vocabulary, those are three unrelated conversations, even though all three people are staring at the same broken capability from three different chairs.
The good news: 2026 offers real shortcuts that didn't exist a few years ago. Ardoq made in-product AI generation of capability maps and value streams generally available in September 2025, after running it in open beta earlier that year. General-purpose AI assistants can now produce a plausible first-draft map from a paragraph describing the business. Capstera's August 2026 roundup notes that AI drafts still need editorial work on level structure, on making sure capabilities don't overlap, and on swapping generic language for the terms the business actually uses. Treat the AI output as a rough cut, not a finished map. The practical move is to generate the draft with AI, then sit down with whoever owns each domain and ask whether the wording matches how they'd actually describe their own job. If it doesn't, that's not a formatting problem, it's a sign the abstraction level is wrong.
Reference content helps too, and most of it is free. APQC's Process Classification Framework is publicly available at no cost. Orbus publishes free Business Capability Starter Maps. The Business Architecture Guild offers industry reference models with membership. None of these hand a small firm a finished map, but they give something better than a blank page: a scaffold to argue with.
The tooling landscape for small firms that need a working map, not an enterprise repository
Tooling splits into two categories that don't really compete with each other, because they're built for different problems.
The first category is the enterprise repository platforms: SAP LeanIX, Ardoq, OrbusInfinity, Avolution ABACUS. All of them price on request as of August 2026, and all of them are built to sell into large organizations with a standing enterprise architecture function, a governance mandate, and a procurement process that takes longer than the mapping project itself. Wrong tool for a ten-person consultancy that needs a defensible map by next month.
The second category is lightweight and mostly free: Jibility (public pricing with a free plan), Sparx Enterprise Architect (a desktop perpetual license running around $240), Archi (free), and ADOIT Community Edition (free). These are built for individual architects or small teams whose actual deliverable is the map, not an ongoing governed system of record. Creately also offers a premium AI capability map template that edits online and exports to common formats, which works fine as a zero-cost starting point for a first draft.
Firms that would rather buy pre-built content than build from scratch can look at commercial capability libraries, like Capstera's domain-specific maps, sold in editable Excel or PowerPoint formats. The trade there is straightforward: pay for the content, save the build time.
There's also a middle tier: transformation suites like Bizzdesign (now merged with MEGA International, acquired fall 2024, and Alfabet, acquired January 2025) and BlueDolphin (rebranded from ValueBlue in April 2026). These sit between the free tools and the enterprise platforms, but they're still built with mid-market and enterprise transformation programs in mind, not a five-person firm trying to figure out where its bottleneck is.
If the goal is strategic alignment and prioritizing where AI or hiring should go, which is the entire point of this exercise, a lightweight tool or a well-organized spreadsheet gets the job done. Don't let picking software become its own project. A capability map, built to fix prioritization problems, gets delayed for months by a prioritization problem about which mapping tool to buy, an irony that occurs more often than it should.
How a capability map turns strategy from a conversation into a structured decision
Without a shared map, strategic conversations tend to produce parallel monologues. Three leaders diagnose the same underlying problem three different ways, because they're each describing it from their own department's vocabulary, and none of those vocabularies overlap enough to reveal they're talking about the same gap.
With a map, the conversation changes shape. Isolate the relevant domain, weigh its strategic importance against how well it's actually performing, then figure out whether the real issue is in workflow orchestration, knowledge management, support operations, or the applications underneath all three. The map just makes the gap visible in terms everyone in the room already agrees on. It just makes the gap visible in terms everyone in the room already agrees on.
The clearest version of this is a heat map. Score each Level 2 capability on two axes: how much it drives competitive position, and how well the firm currently performs it. Plot all of them, and one quadrant, high importance paired with low performance, is where the real conversation belongs. Everything else is either fine as-is or not worth the argument.
This framing generalizes cleanly. Where to invest, where to cut, whether a new service line is even feasible given current gaps, all of it runs through the same quadrant logic. And because the map is stable, that heat-mapping exercise doesn't reset every time someone leaves or the firm switches to another vendor. Orbus Software's 2025 guide states that capability maps support transformation work by connecting capabilities to strategic goals, so each function's contribution to the bigger outcome stays visible instead of getting re-litigated every quarter. That's the alignment function doing the real work, not just the pretty diagram.
Using the map to find the real bottleneck, not the loudest problem
The loudest complaint in the building is rarely the actual constraint. A firm drowning in quote requests usually assumes it needs more salespeople. Pull up the map and the real issue is often sitting one level up: a broken Lead Qualification capability that lets unqualified leads clog the pipeline, making everything downstream look like a staffing problem when it's actually a filtering problem.
A genuine bottleneck capability shows three traits worth checking against the map directly. It carries high strategic importance: fixing it unlocks growth rather than just easing an annoyance. Its current performance is measurably low, not just unpopular around the office. And other capabilities pile up behind it, so fixing the bottleneck relieves pressure across the whole map, not just in the one lane everyone's staring at.
The patterns repeat by industry. Service firms commonly surface bottlenecks in customer-facing capabilities such as Customer Support or Sales, where gaps in qualification or resolution slow everything downstream. Accounting and financial services firms often find their constraints in data-intensive capabilities, where errors introduced early become visible much later in reporting or compliance. Firms handling high volumes of structured, repetitive work frequently find their bottlenecks in document processing and workflow orchestration, the kind of work that crowds out higher-value activity.
The map's real value is separating the symptom from the cause at the right altitude: specific enough to act on, abstract enough to stop "slow quoting" from getting mistaken for "not enough salespeople" when the actual gap is "no structured qualification process." Skip that diagnostic step and AI tools end up pointed at the visible symptom instead of the root cause, which is the single biggest reason these implementations stop paying off after the initial bump.
As AI tools get bolted onto more capabilities, firms increasingly lose track of which capabilities have quietly become AI-dependent. As AI tools get bolted onto more capabilities, firms increasingly lose track of which capabilities have quietly become AI-dependent, or where an unmanaged AI tool has wired itself into a critical function without anyone noticing. A capability map that tracks which capabilities have AI systems plugged into them heads that blind spot off before it becomes one.
What the AI adoption data says about SMBs that skip the prioritization step
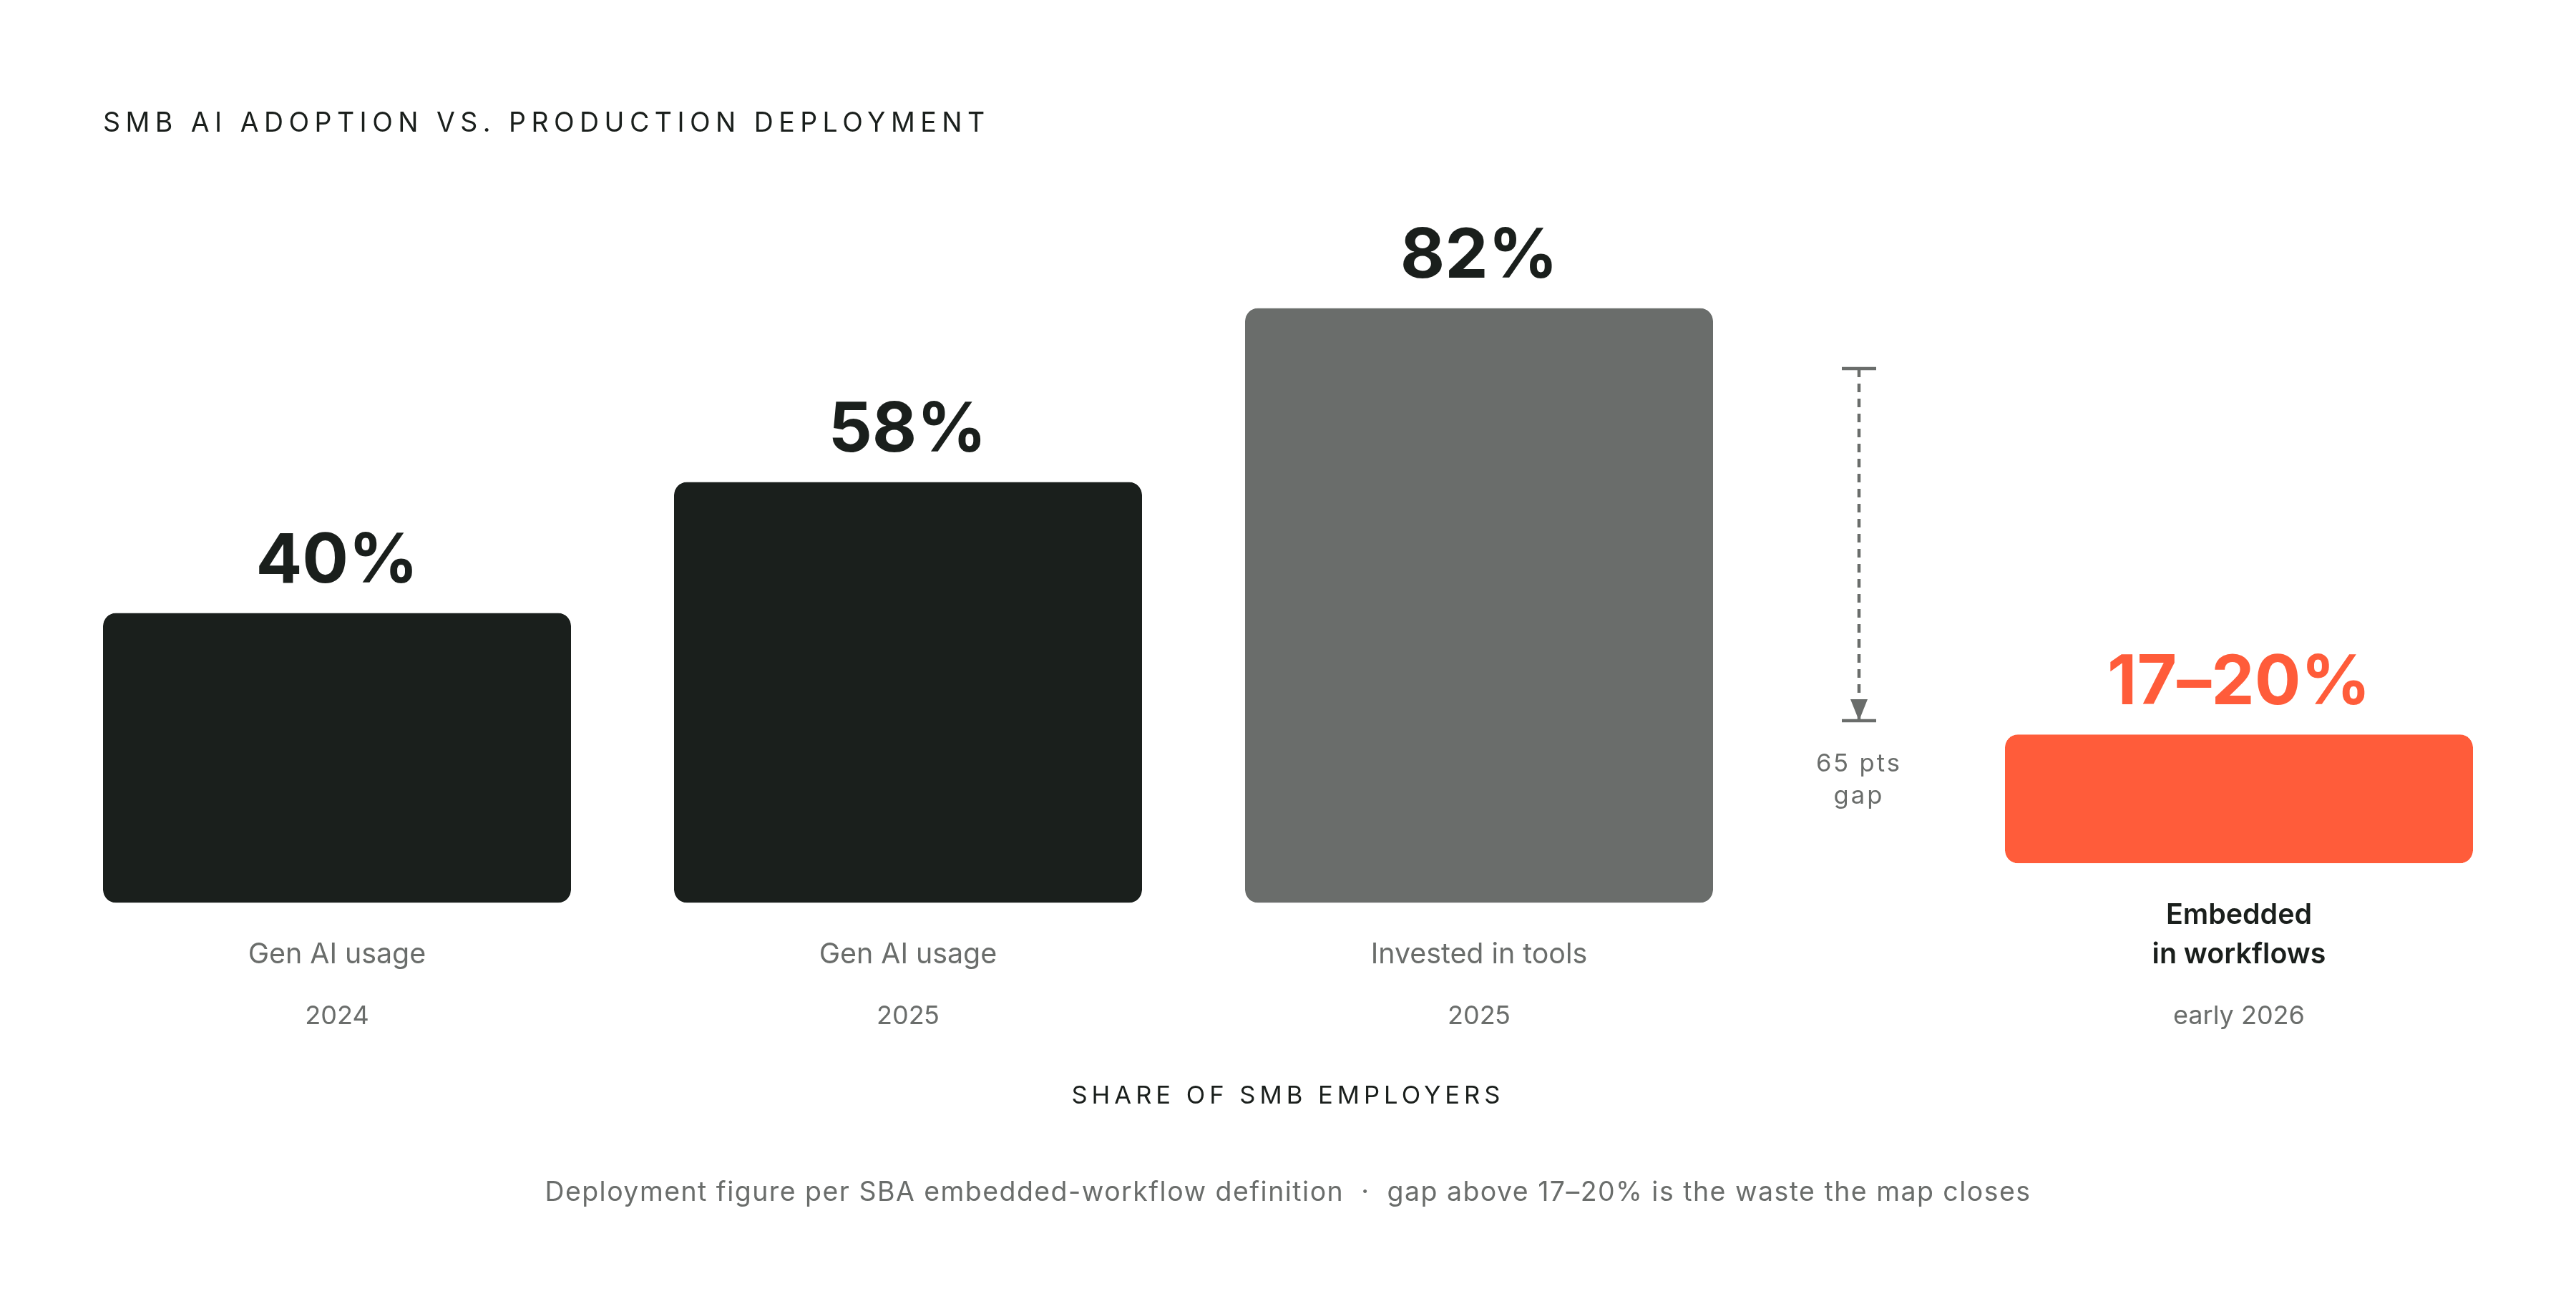
Adoption numbers alone tell a misleading story. Generative AI usage among small firms jumped from 40% to 58% between 2024 and 2025, the national chamber of commerce found. Chamber of Commerce's 2025 Empowering Small Business Report found 76% of firms now using or exploring it. The Small Business & Entrepreneurship Council's 2026 survey found 82% of small business employers had already invested in AI tools, running a median of five tools at once.
Production deployment tells a different story. Under the SBA's stricter definition, meaning AI actually embedded in real day-to-day workflows rather than sitting open in a browser tab, deployment is between 17% and 20% through early 2026. That's a wide canyon between "using AI" and "AI actually producing value," and it's exactly the canyon a capability map is built to cross.
The waste data makes the cost tangible. Audits of more than 100 companies, ranging from 10 to 500 employees,, found 87% of SMBs carrying significant waste in their AI tool spend, with median annual waste around $18,000. After systematic optimization, average ROI rose 3.5x, and 60% of companies hit break-even within three months. "Systematic optimization" Systematic optimization means figuring out which capability a given tool should actually live inside, and whether that capability was ever the bottleneck to begin with. It means figuring out which capability a given tool should actually live inside, and whether that capability was ever the bottleneck to begin with. That's the exact question the map answers.
The growth data underscores the same point from another angle: 83% of growing SMBs have adopted AI, versus 55% of declining ones, according to 2026 figures. The gap isn't access. Every one of these firms can buy the same tools off the same websites. The gap is whether the tool landed on the capability that was actually constraining growth. Business.com's Small Business AI Outlook Report found average employees saving 5.6 hours a week with AI, managers saving 7.2 and individual contributors 3.4, but time saved inside a capability that was never the bottleneck doesn't raise the ceiling on what the business can do. It just makes the wrong work faster.
The ROI case for targeting the right capability first
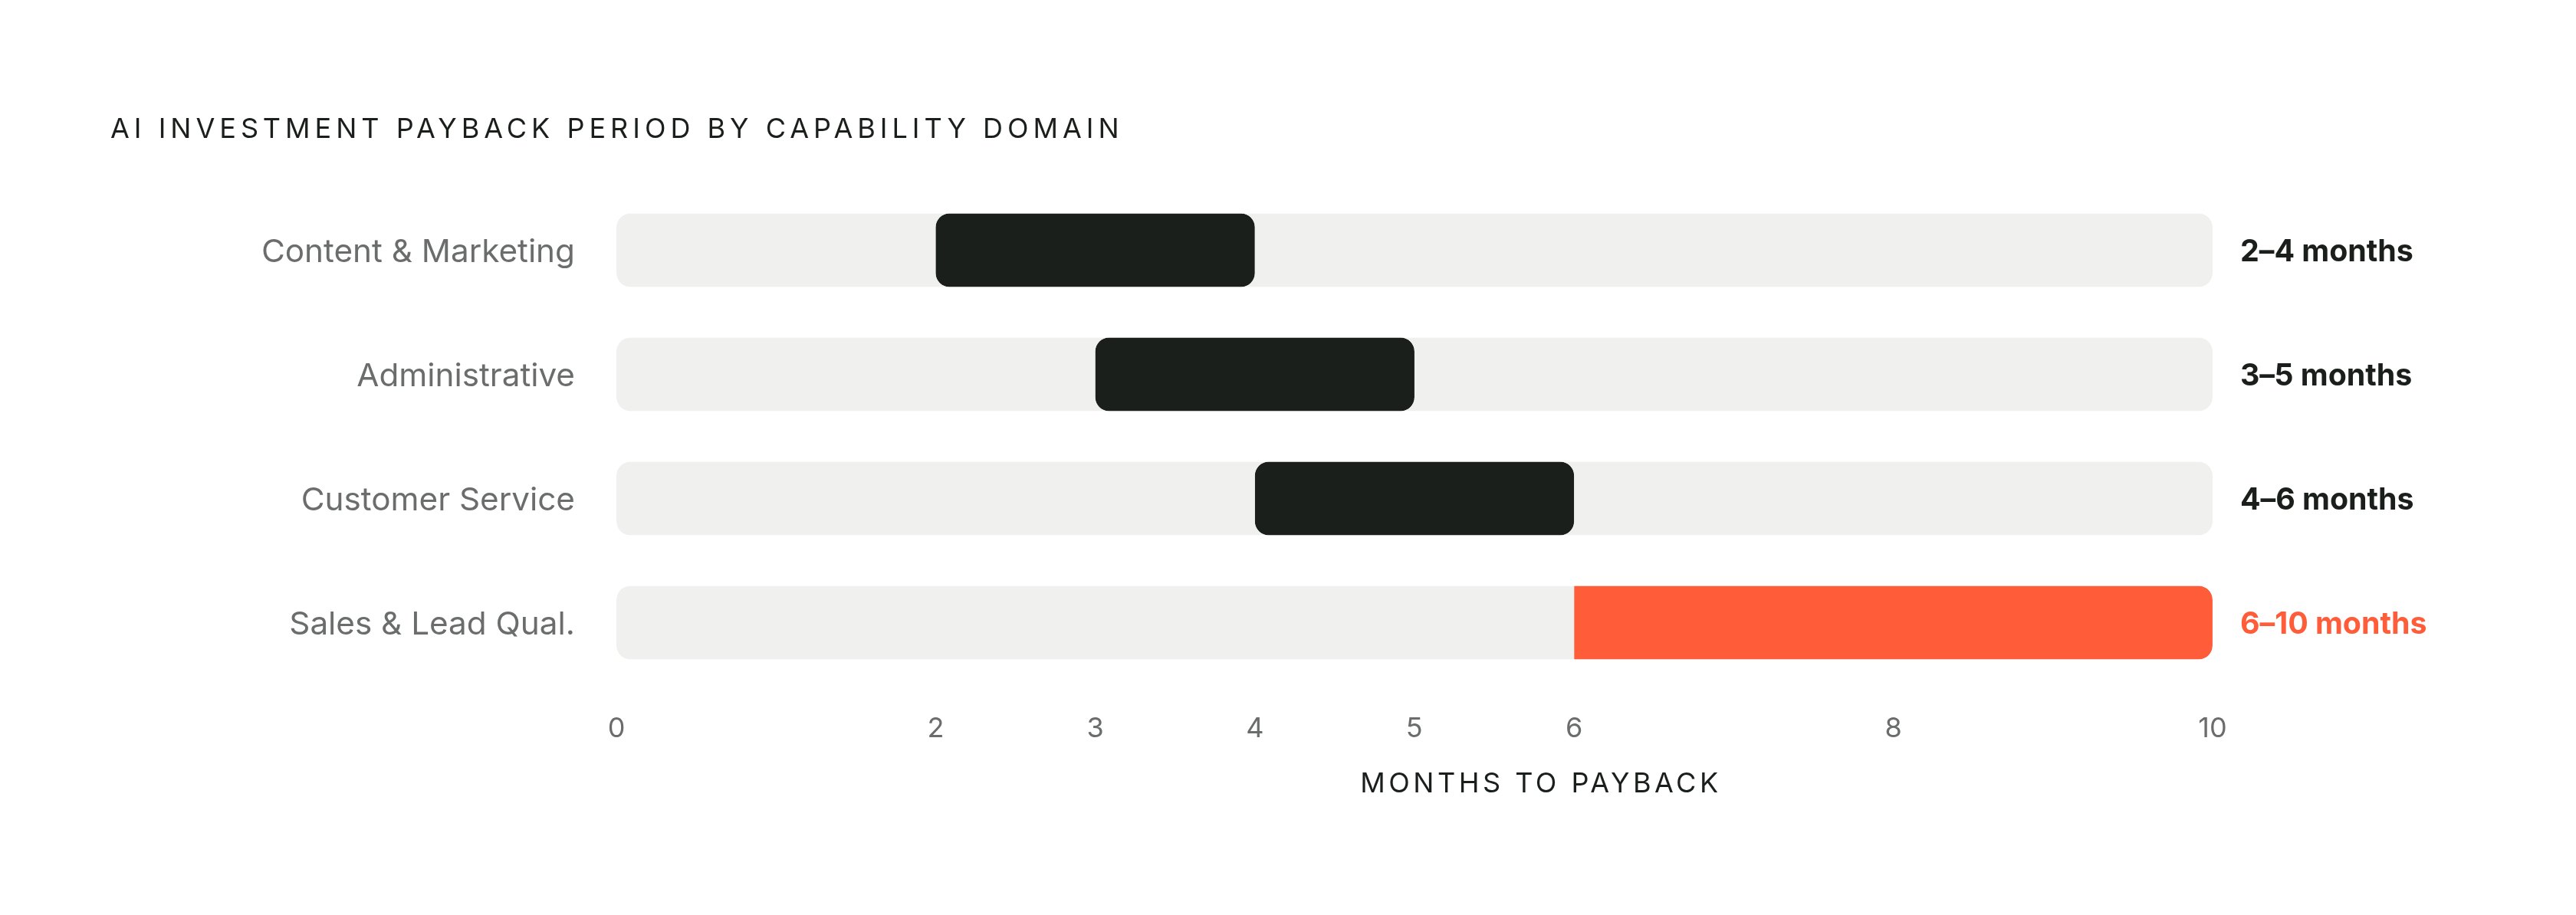
Payback periods vary sharply by domain, and knowing the range matters before picking where to spend. Neomeric's 2026 research puts customer service automation, AI teammates, chat, and ticket routing, at a 30% to 50% cut in handling time with payback in 4 to 6 months. Administrative automation, scheduling, invoicing, data entry, saves 20% to 40% of time with payback in 3 to 5 months. Sales and lead qualification tools bring a 15% to 25% lift in qualified conversion, but take longer to pay back, 6 to 10 months. Content and marketing automation is the fastest and cheapest: 40% to 60% less time spent producing content, with payback in just 2 to 4 months.
The broader picture backs this up. An Adobe survey of 431 small business owners found 47% reporting increased revenue after adopting AI, with a self-reported average lift of 21%. A separate survey from a small business advocacy group. survey found 73% of small businesses calling AI and digital tools important to staying competitive, and well-targeted implementations typically reaching positive ROI within 4 to 8 months.
None of that erases the counterpoint, and it deserves equal airtime rather than a footnote. A recent MIT report found 95% of integrated AI pilots failing to produce measurable return. BCG's 2025 survey put median ROI at just 10%, with a meaningful share of leaders reporting limited or no gains at all. It's proof that untargeted AI doesn't work, which is a very different, much more fixable, problem. It's proof that untargeted AI doesn't work, which is a very different, much more fixable, problem.
The payback figures above only hold if the automated capability is actually the bottleneck. Apply AI to a capability that was never constraining growth and the time savings are real but invisible at the business level, like sanding down a doorframe when the real problem is the foundation. The map is what tells you which tools sitting in your stack are worth keeping, and which capability deserves the next one.
AI vs. hiring: what the cost structure looks like when you have identified the bottleneck capability
Once the bottleneck capability is identified, the math comparing one model against hiring gets a lot more concrete, and a lot less flattering to hiring.
A $45,000-a-year employee doesn't cost $45,000. Fully loaded, with payroll taxes, benefits, workers' comp, equipment, and training folded in, that number runs $58,000 to $72,000. Factor in roughly 1,800 productive hours a year after PTO, sick days, and holidays, and the effective cost is $32 to $40 per productive hour, before that person has produced a single deliverable.
Then there's the ramp. New hires take meaningful time to reach full productivity, which means the firm pays full salary for partial output during exactly the window when the bottleneck is squeezing hardest. And a significant share of new hires leave within the first year, which means some fraction of that ramp cost gets paid twice: once for the hire who left, and again for whoever replaces them. None of that is a knock on hiring as a strategy. It's the honest cost structure that a decision often gets made without, on gut feel instead of the map that would have clarified it in the first place.