Quantitative Market Research on a Small Business Budget
Four tools unlock data-driven decisions without research firm costs.

Quantitative research, stripped of academic pretension, is structured data collection that produces measurable, comparable findings. It excludes ethnography and founder's instinct dressed up in a slide deck. A qualitative interview series with five customers, no matter how illuminating those conversations were, falls outside the definition.
The methods realistically available to a small business without a research department are narrower than the full academic canon, and that constraint is fine. Surveys with closed-ended questions, pricing sensitivity analysis using Van Westendorp or Gabor-Granger frameworks, segmentation from existing CRM or purchase data, and competitive benchmarking via search and audience intelligence tools cover the majority of decisions an SMB actually needs research to inform. None of this requires a statistician on staff, a panel of thousands, or a bespoke research design built from scratch.
The sample size conversation people avoid
The recurring anxiety among small business owners who attempt in-house research is the sample size question, and it is largely misplaced. For the decisions most SMBs are actually making, samples in the low hundreds produce actionable signal. Validating a pricing tier, testing a new service concept, understanding which customer segment reports the highest satisfaction: none of these require the statistical power demanded by a clinical trial or a nationally representative omnibus study.
The operative distinction is precision versus direction. A pricing study with 150 responses that reveals demand eroding sharply above a certain threshold is more useful than no study at all. It needs to be honest about what it can and cannot support, and it needs to be designed well enough that the signal is real.
Question design, consistent methodology, and intellectually honest interpretation are the primary determinants of research quality in most SMB research contexts. A badly designed survey fielded to thousands of people produces thousands of data points of noise. That is the central problem.
The survey stack that covers most SMB research needs for under $500 a month
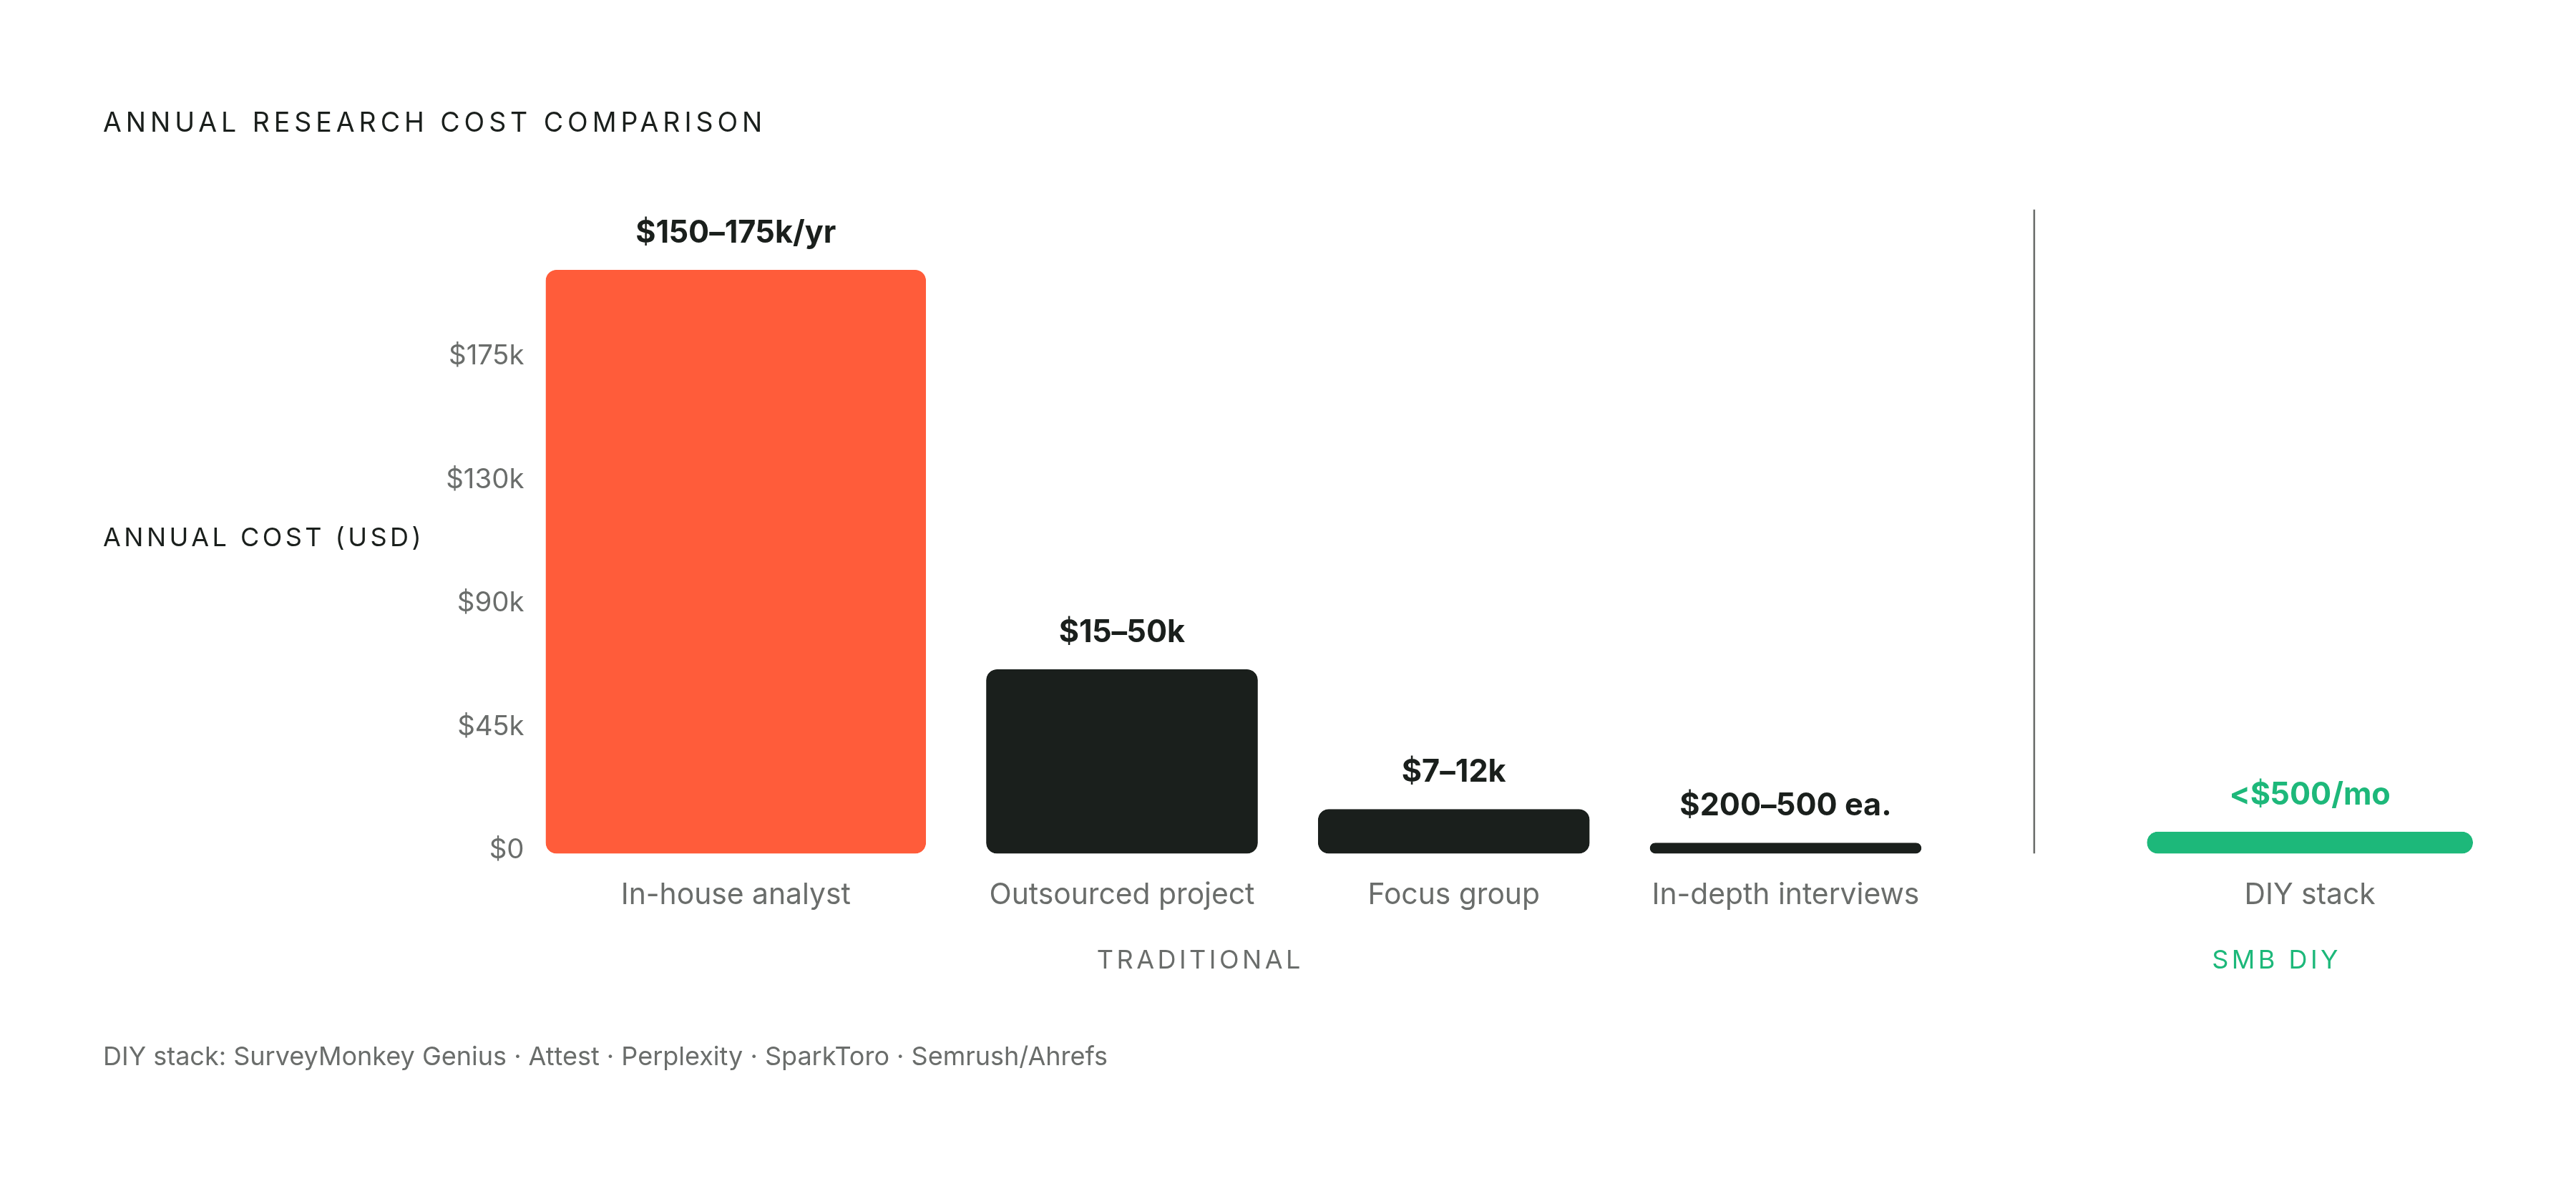
The traditional research budget shock comes from the aggregate. A single in-person focus group runs $7,000 to $12,000. Online survey responses for general audiences cost $15 to $50 per response. In-depth interviews can run $200 to $500 each, fully loaded. A complete outsourced project lands somewhere between $15,000 and $50,000 and takes four to eight weeks, per Qualtrics 2025 figures. Hiring an in-house analyst looks cheaper until the fully loaded cost with benefits, tools, and overhead reaches $150,000 to $175,000 annually. And secondary research alone, just reviewing existing data, reports, and publications, consumes between 40 and 60 percent of total research time, according to Greenbook's 2025 data.
The current tooling landscape makes most of that expenditure unnecessary for SMB-scale decisions.
Two platforms worth anchoring the stack around
SurveyMonkey Genius and Attest both sit in the $200 to several hundred dollars per month range and cover functions that previously required separate vendors and a skilled analyst: AI-assisted question design that catches leading or ambiguous phrasing before launch, access to screened respondent panels without cold outreach, and automated cross-tabulation with summarized open-ended responses. The analysis step that once required someone with a graduate statistics degree now surfaces as a starting point the business owner can interrogate and refine. Neither platform is perfect, and neither replaces judgment, but both are credible instruments for SMB-scale research.
The secondary research layer
Before fielding any primary survey, the business needs to understand the landscape it is operating in. Perplexity AI's free tier compresses the secondary research phase significantly, handling the literature and report review that historically consumed the largest share of research time. SparkToro adds audience intelligence, showing where a target audience actually spends its attention rather than where the marketing team assumes they do. Semrush and Ahrefs provide demand-sizing signals and competitive positioning context through search data.
The sequencing matters: secondary research first to establish context, then survey design informed by those findings, then analysis. Running it in the wrong order produces surveys that ask the wrong questions with great confidence.
Cost crossover to keep in mind
For businesses running three or more research projects per year, the AI-assisted tooling stack is demonstrably more cost-effective than any alternative. For one or two projects annually, one-time consulting still competes on value. Per analysis from Cascade Digital Marketing (January 2026), that crossover point is worth calculating explicitly before committing to either path.
Running a pricing analysis without a research firm
Most small businesses price on cost-plus or competitive copying. Cost-plus is a production accounting exercise, a tool for internal accounting rather than market intelligence. Competitive copying assumes the competitor priced correctly, which is a generous assumption. Both methods bypass willingness to pay, the one number that determines a price's effectiveness.
Pricing research is the highest-leverage starting point for SMB quantitative work because the revenue impact of getting it wrong compounds immediately.
Two frameworks that work without external support
The Van Westendorp Price Sensitivity Meter requires four survey questions establishing the thresholds at which a price seems too cheap, cheap, expensive, and too expensive to the respondent. The output is an acceptable price range and an optimal price point, derived from where the four response curves intersect. Gabor-Granger is simpler still: present a series of price points and ask respondents to indicate their purchase likelihood at each. It is better suited to testing a single product or pricing tier, and the resulting demand curve is straightforward to interpret.
How to field it without priming respondents
Embed pricing questions inside a broader customer survey rather than fielding a standalone pricing study. A survey that leads with price questions primes respondents to anchor on cost; one that establishes context first produces more naturalistic responses. Segment responses by customer type. The willingness-to-pay gap between existing customers and prospects is frequently the most operationally useful finding in the entire study. Field against a screened panel through Attest or SurveyMonkey, or, for existing customers, against your own email list.
What the output actually tells you
A defensible price range, not a single magic number. The value of pricing research is knowing where demand starts to erode, not finding a price to engrave permanently on the product page. Pricing research reflects stated preference, not actual purchase behavior, and anyone who tells you otherwise is selling something. Treat the output accordingly: useful intelligence, not gospel.
AI persona tools and where they earn their place in the research sequence
AI persona tools simulate consumer responses using synthetic profiles grounded in real behavioral and psychological data. No recruitment, no panel lead time, no waiting. Tools in this category (Atypica.AI being one named example) can return results in ten to twenty minutes at costs the company describes as 100 times lower than traditional agencies. Exploratory AI-driven research more broadly runs in the $2,000 to $8,000 range with results in one to three weeks rather than the eight to sixteen weeks a traditional agency engagement requires.
Studies show AI personas grounded in real behavioral data achieve 80 to 90 percent correlation with actual consumer responses. That is a strong signal, though fielding with real humans remains a distinct methodology, and the choice matters depending on what you are trying to decide.
Where this method earns its place
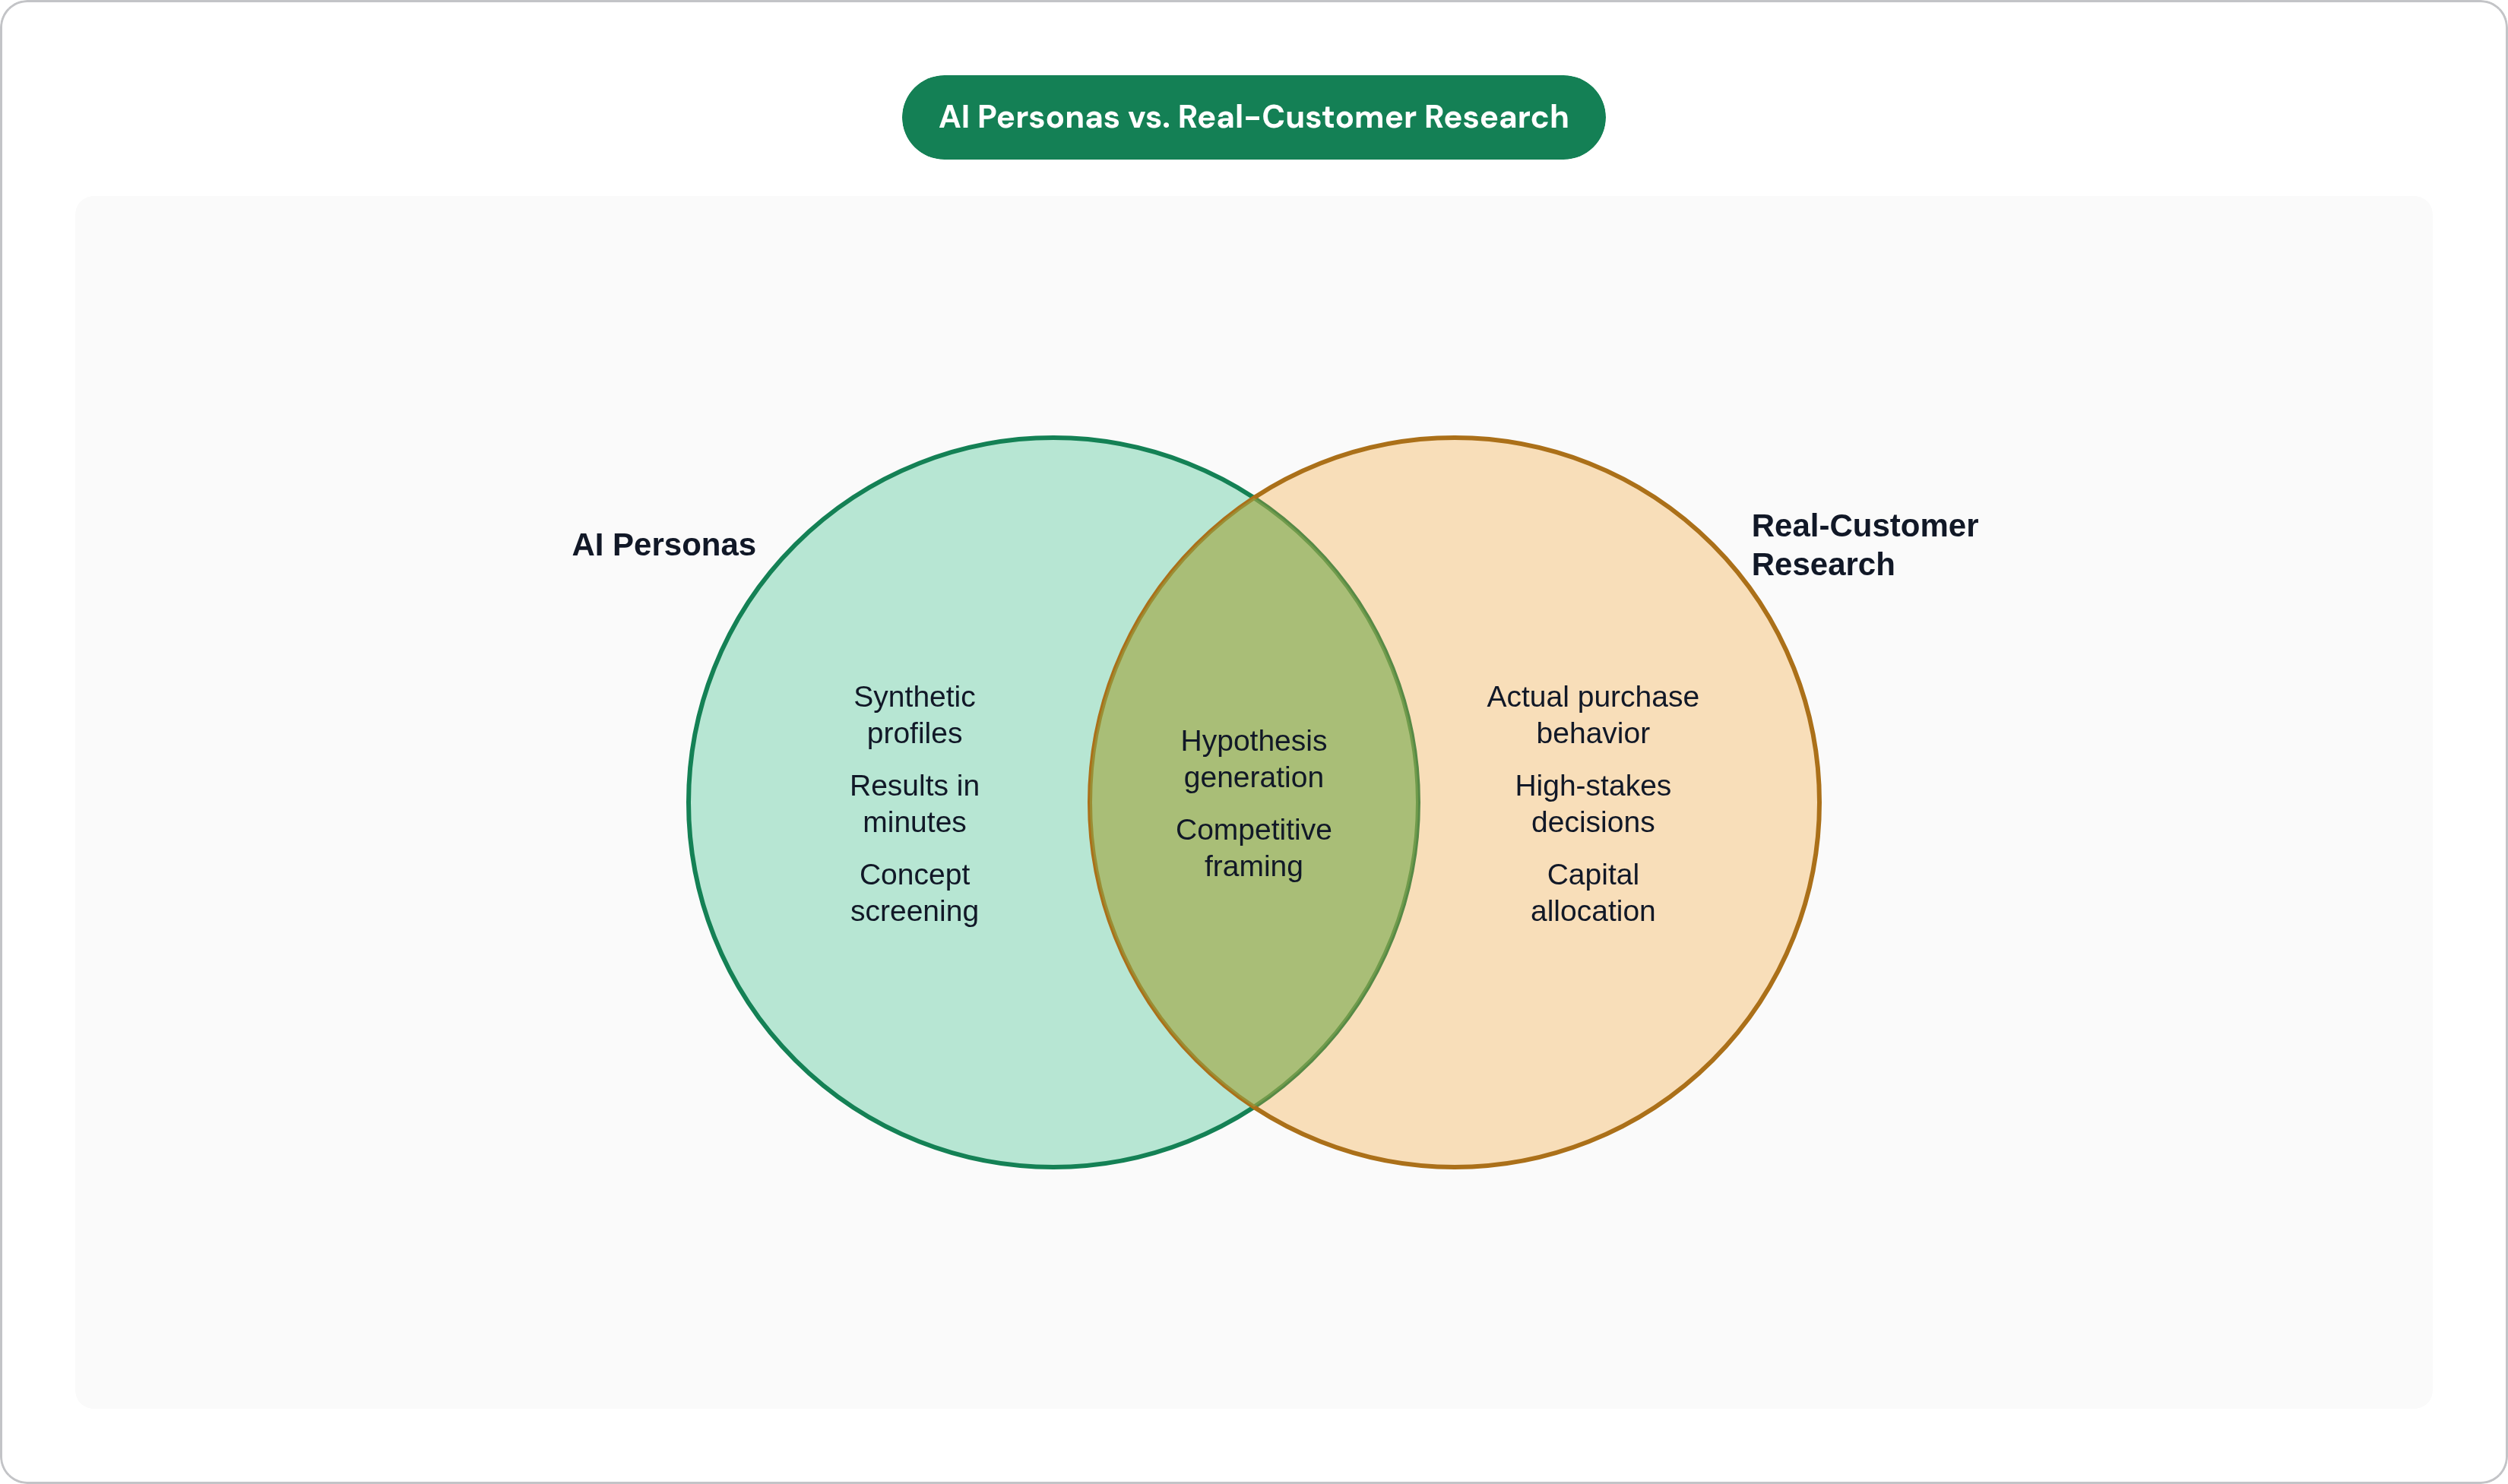
Early-stage concept screening is the clearest legitimate use case. If a business has five positioning statements and needs to eliminate three before spending real money, AI personas can do that work in an afternoon. Rapid competitive framing, understanding how a synthetic target audience perceives the competitive landscape, is similarly appropriate. The best use of all is hypothesis generation before designing primary research questions: the tool accelerates the thinking that needs to happen before real research begins, and it is cheap enough to run several iterations.
Where it should not be the final word
Pricing decisions where the delta between tiers is small, any research feeding a major capital commitment, any decision where being wrong costs more than the research itself: these require primary data from real customers. Using AI personas as a replacement for real-customer validation on high-stakes decisions is indefensible as a methodology regardless of a vendor's accuracy claims. The right mental model is AI personas as an accelerant for early thinking, reserved for the exploration phase before consequential validation begins.
Segmenting your existing customer base with data you already have
Most small businesses with twelve or more months of customer data already hold the inputs for meaningful segmentation, accessible before fielding any survey or recruiting any panel respondent. The data exists in the CRM, the invoicing system, or the point-of-sale records. It goes analytically unused in most cases, which is a fairly expensive oversight.
Basic segmentation variables available in most of these systems include purchase frequency and recency, average transaction value, service or product mix purchased, and geographic concentration. None of this requires a data warehouse or a data scientist.
RFM segmentation in a spreadsheet
RFM, standing for Recency, Frequency, Monetary value, is a structured segmentation framework with decades of application in direct marketing and retention strategy. It assigns customers to tiers based on how recently they purchased, how often they purchase, and how much they spend. The analysis runs in a spreadsheet. The output surfaces the customers who actually drive revenue, frequently a different list from the one the team believes is true, and the gap appears more often than anyone finds comfortable to admit.
The practical output of a basic RFM analysis is a matrix of high-value, high-growth-potential customers on one axis against high-cost, low-growth customers on the other. That matrix directly informs where to concentrate acquisition spend and where raising prices is likely to be absorbed without meaningful churn. AI-assisted tooling (spreadsheet add-ons and lightweight BI platforms) can automate the clustering step that previously required an analyst. The work runs in an afternoon.
The connection to survey work
Once internal data has defined the segments, primary surveys can be targeted at the highest-value segment specifically. Precision targeting of this kind increases signal quality without increasing sample size, which is the most cost-efficient improvement available to any SMB research program.
Designing survey questions that produce usable quantitative data
The most common SMB survey mistake is letting open-ended questions dominate what the business is calling a quantitative survey. Open-ended responses produce qualitative data suitable for exploration and context, and they should be rationed accordingly in a survey designed for quantitative output.
Question types that produce quantitative signal
Likert scales, either 1 to 5 or 1 to 7, measure attitude and satisfaction in a form that produces mean scores, distributions, and trend lines over time. Rank-order questions establish priority and preference. Single-select and multi-select questions generate categorical data that cross-tabulates cleanly. Numeric input fields capture frequency, spend estimation, or quantity in a directly analyzable form. These are standard instruments with outputs that are straightforward to interpret.
The leading question traps that survive every internal review
Loaded phrasing embeds an assumption: "How much do you enjoy our excellent service?" cannot produce a negative finding by construction. Double-barreled questions, asking about price and quality in a single item, produce an answer that cannot be attributed to either variable. Acquiescence bias, clustering all positive options on one end of a scale, inflates positive response rates artificially.
AI-assisted question design in SurveyMonkey Genius and Attest flags many of these problems before launch. Use it as a first-pass quality check, then read the questions aloud to a human being. Preferably one who will tell you the truth.
Pre-launch discipline
Run the survey with five internal respondents before fielding to any panel. This catches confusing instructions, broken skip logic, and questions that make perfect sense to the person who wrote them and no sense to anyone else. Use the same question wording across survey cycles; changing a single word changes the measurement instrument. Survey length discipline matters equally: response quality degrades meaningfully after roughly ten to twelve minutes of completion time. Prioritize the three or four questions whose answers would actually change a decision, then stop.
Interpreting results honestly (what the data supports and what it doesn't)
The most corrosive interpretation mistake in SMB research is treating a finding from one survey wave as a settled fact rather than a data point. The temptation is understandable. The business paid for the study, the respondents answered the questions, and the platform produced a clean summary. It feels conclusive. A finding showing that a clear majority of respondents prefer one option is a strong directional signal; it is not a promise about how the broader market will behave. The useful test is whether a different sample of similar respondents plausibly reverses the finding. If the answer is yes, treat it as directional and act accordingly.
Cross-tabulation as the most useful analytical step
Aggregate findings hide things. An average satisfaction score that looks acceptable frequently conceals a delighted core customer segment and a frustrated fringe segment. Breaking results down by customer tenure, product type, or acquisition channel surfaces the finding beneath the finding. Cross-tabulation is a basic analytical technique that most SMB surveys leave unused.
When to act versus when to validate further
Operational decisions, messaging tests, pricing adjustments within an established range: these can reasonably proceed on directional data. New product development, major capital allocation, and market entry decisions warrant validation with real-customer primary data before commitment. A modest, consistently designed quarterly survey of a hundred customers produces more actionable intelligence over time than one expensive annual study, because direction and rate of change matter more than a single snapshot. The business that knows satisfaction is declining at a specific rate among a specific segment can intervene. The business with one annual data point can only react.
Pair survey data with actual transaction data wherever possible. Survey data captures stated intent; transaction data captures actual behavior. The gap between those two things is often where the real insight lives.
Building a repeatable research rhythm instead of one-off projects
A single study conducted two years ago is a data artifact, one that creates organizational confidence in conclusions that have quietly aged out of relevance. Markets move. Customer expectations shift. A pricing study from three years ago is a historical document, and treating it as current intelligence is its own category of error.
A lightweight quarterly rhythm an SMB can sustain
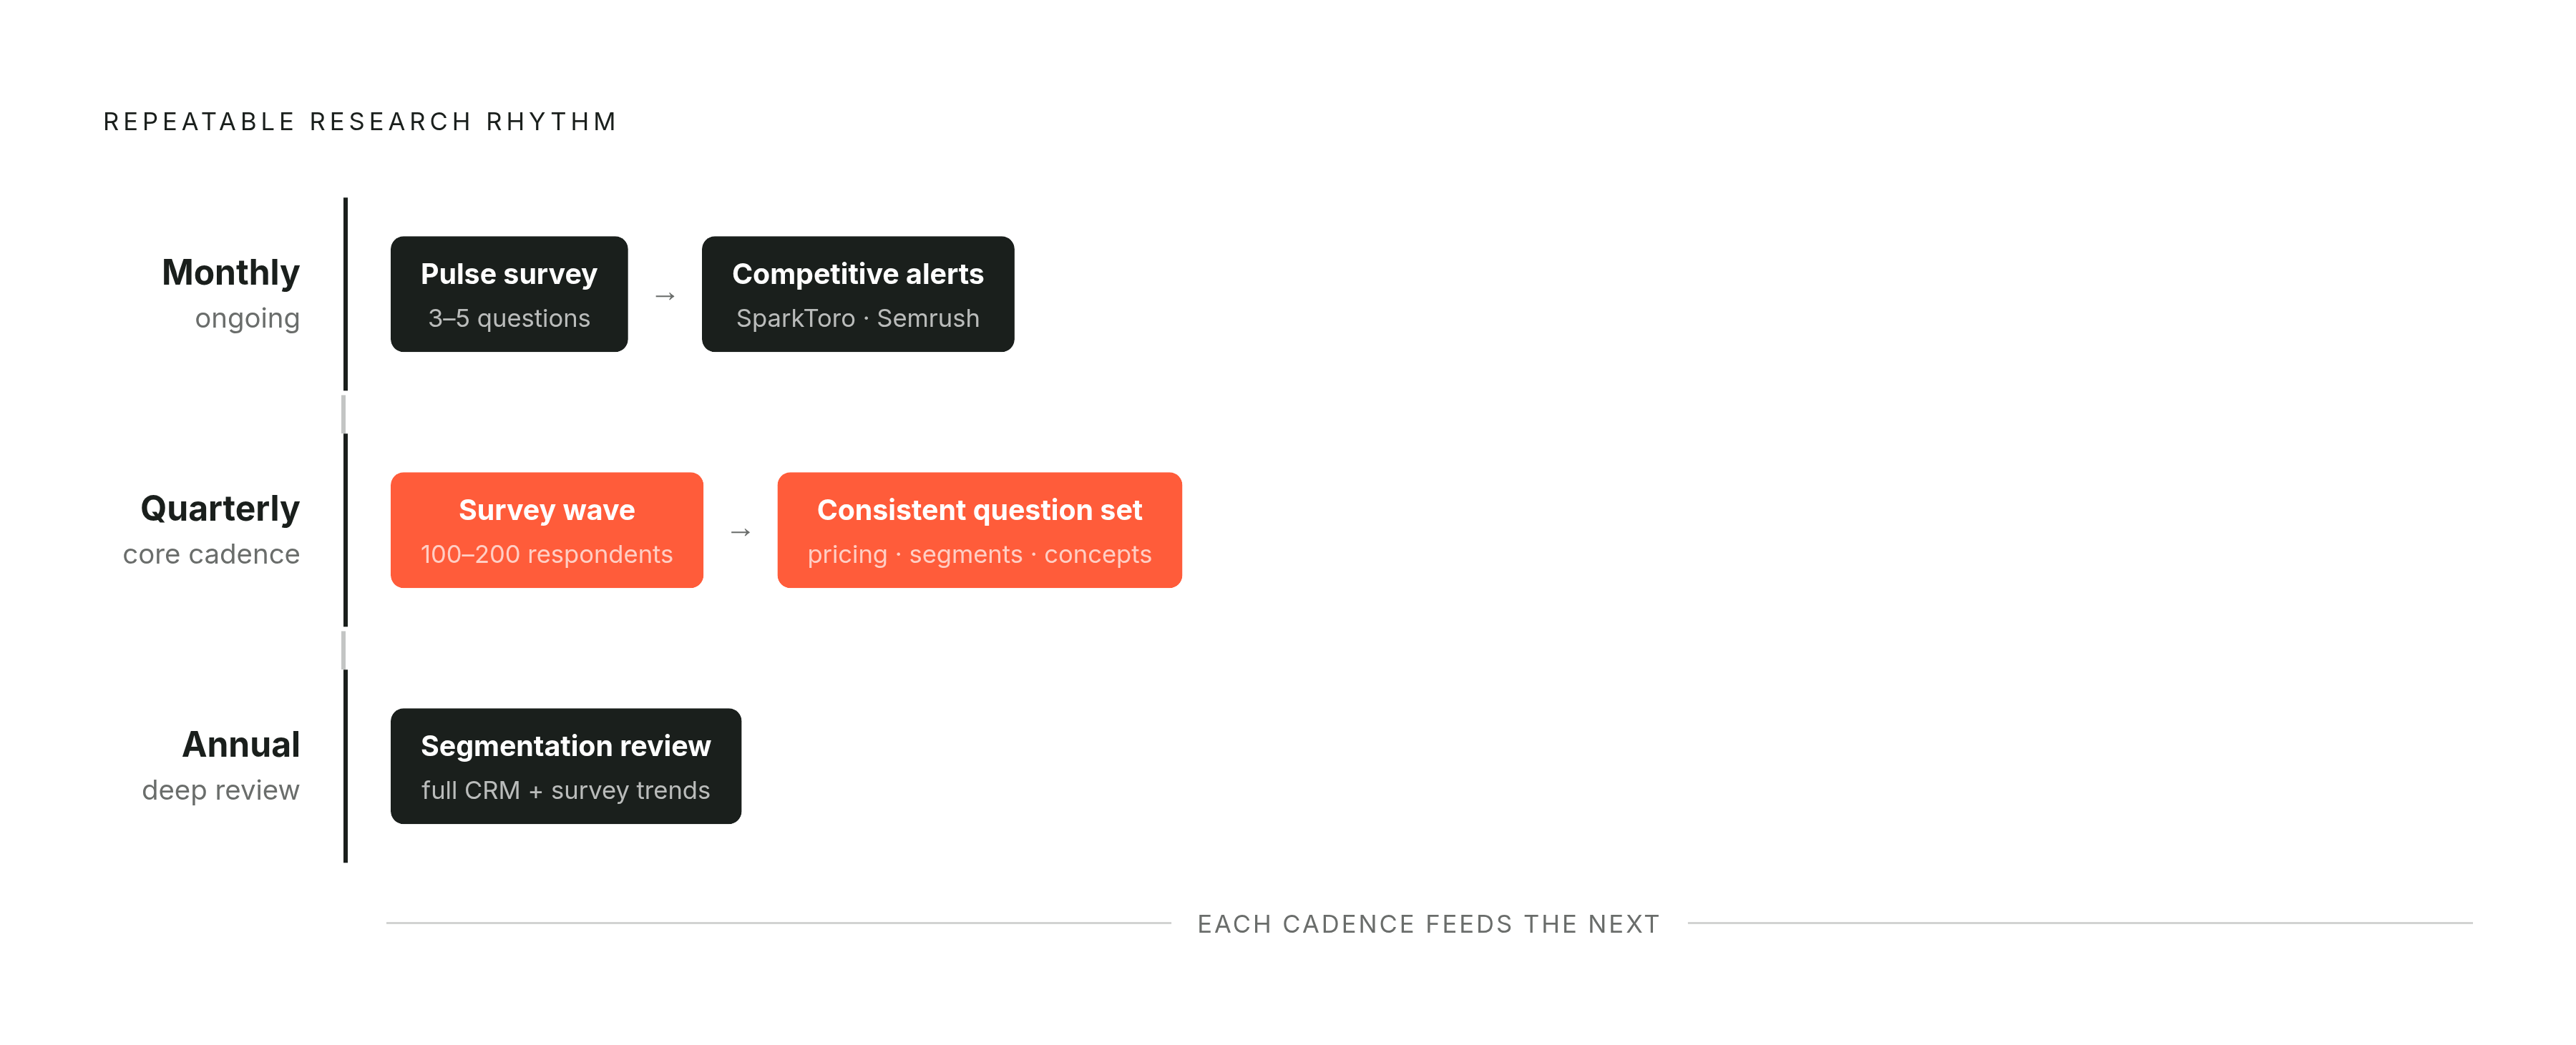
Monthly, the work is passive: a customer satisfaction pulse of three to five questions, competitive monitoring through SparkToro or Semrush alerts. This is a standing process that runs largely on its own once established.
Quarterly, one focused survey wave covering either pricing, segment satisfaction, or a new concept test, fielded to 100 to 200 respondents against a consistent question set. The consistency is the mechanism. It is what allows the business to see movement rather than just position. Annually, a deeper segmentation review pulling from a full year of CRM data and the accumulated survey trend. Each wave of data improves the next survey's question design, sharpens segment definitions, and raises the baseline against which new findings are compared. The process gets more precise over time without adding cost.
The cost of sustaining this
Well within a $500 per month tool budget when secondary research, survey platform, and audience intelligence functions are combined. A 2025 U.S. survey found that 73% of small businesses identified AI and digital tools as important to their competitiveness and growth. Affirming that in a survey response is easy. The businesses running a standing research function are the ones actually positioned to act on it.
Internal ownership
Designate one person to own the research calendar, responsible for holding the rhythm and routing findings into decisions rather than into a folder that accumulates quietly on a shared drive. The research process is only as valuable as its influence on what the business does next. Without a designated owner, the rhythm collapses after the first quarter, every time.
The businesses that treat market research as a periodic event will continue to be surprised by the market. The ones that treat it as a standing function will, over time, stop being surprised, and in a market where most SMBs are still pricing on instinct and copying competitors, that is a meaningful edge.