Secondary Market Research Sources for SMB Decision-Making
How survey design choices create wildly different AI adoption findings.

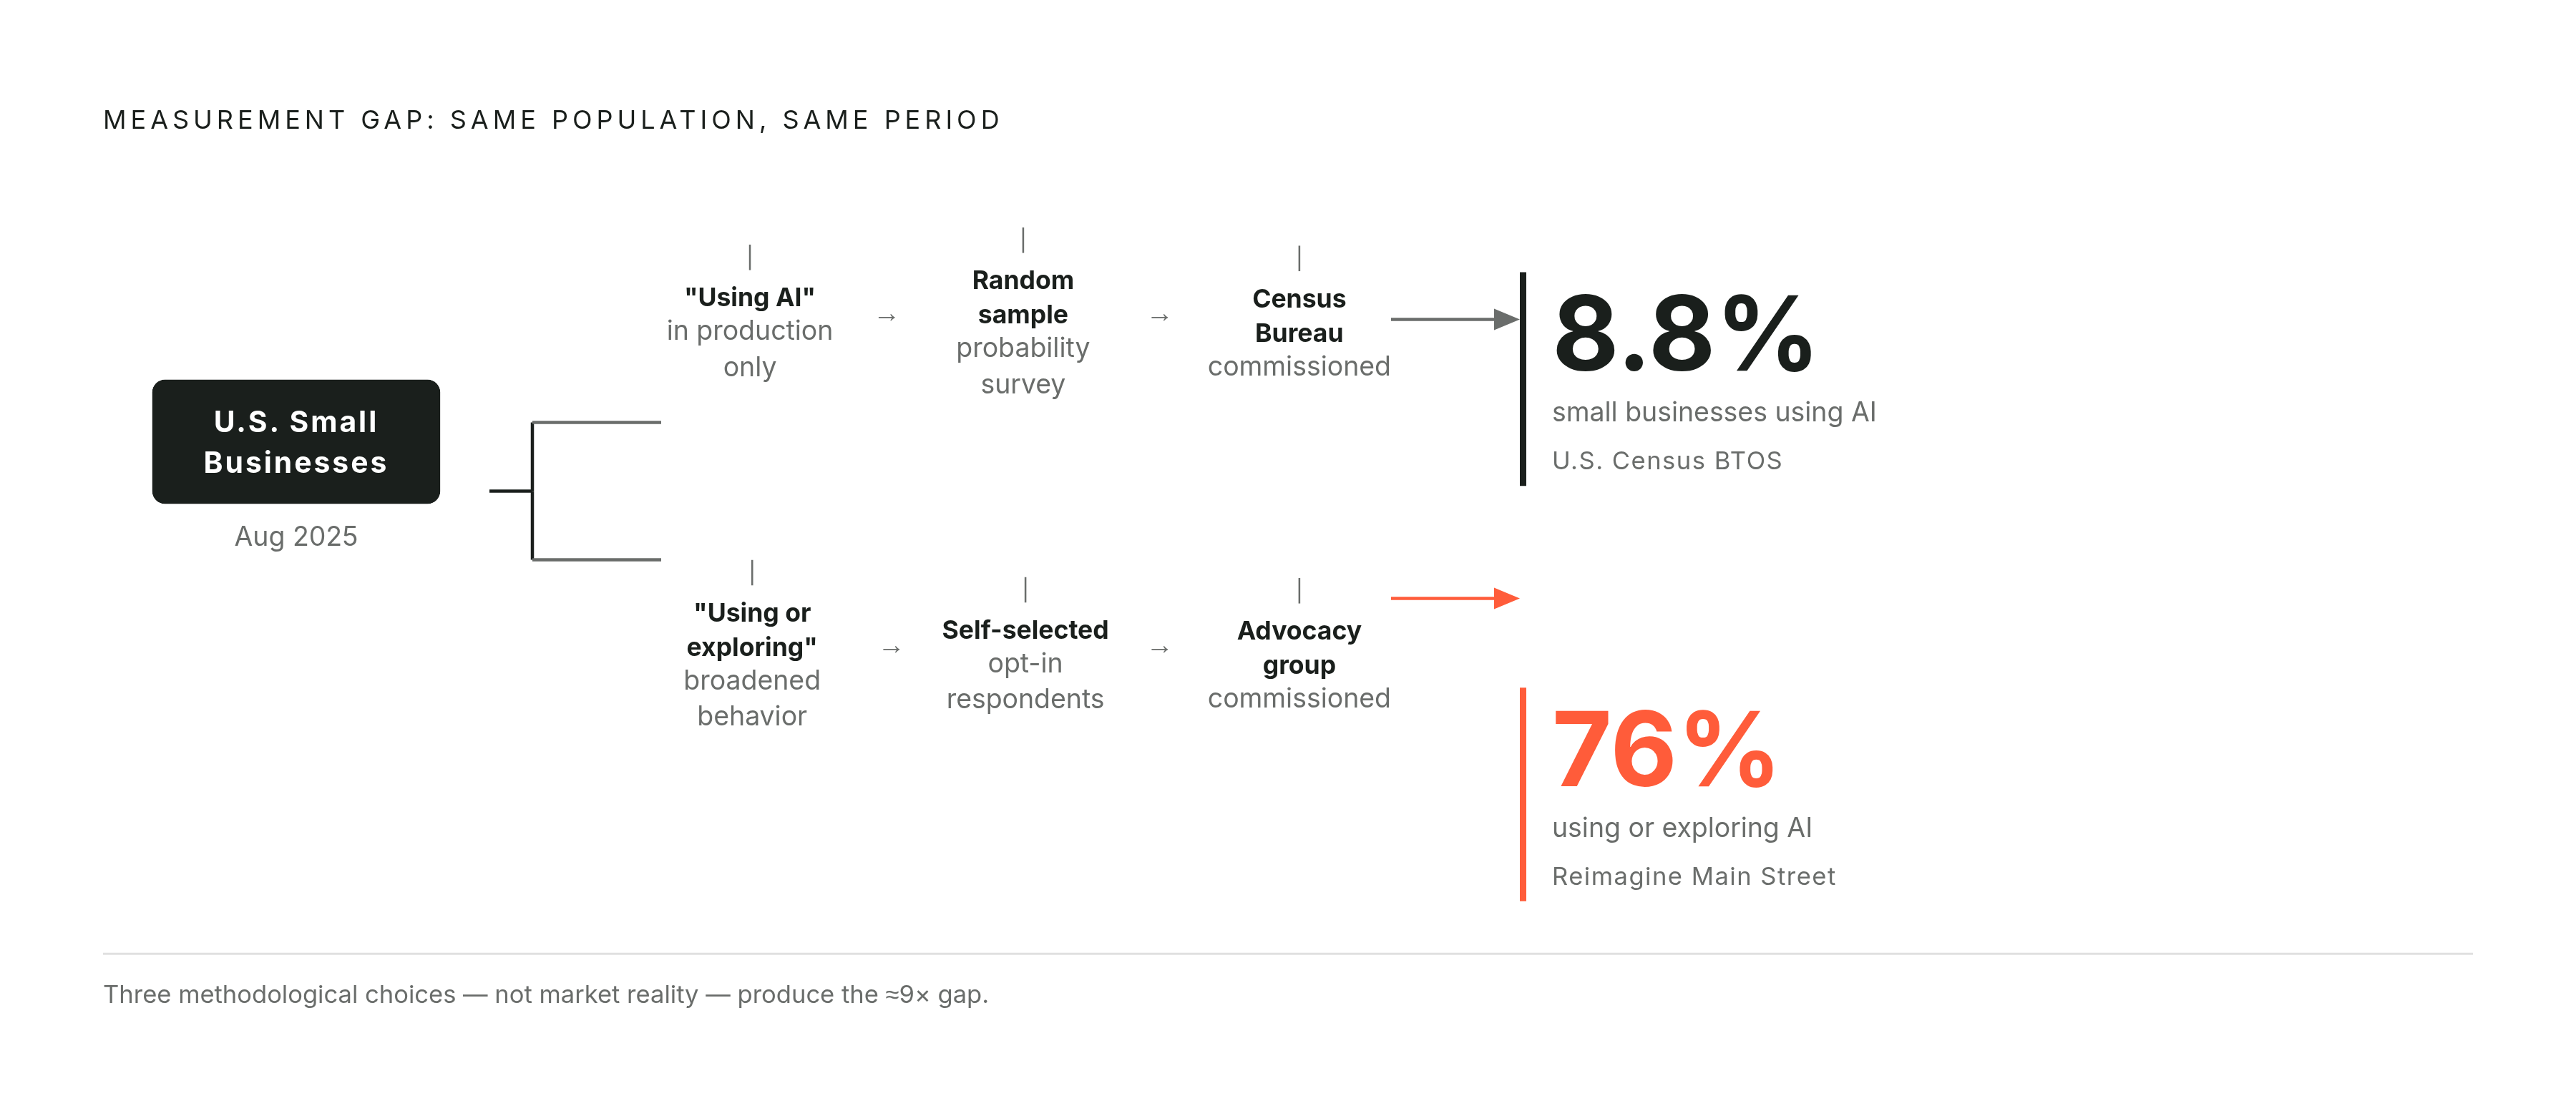
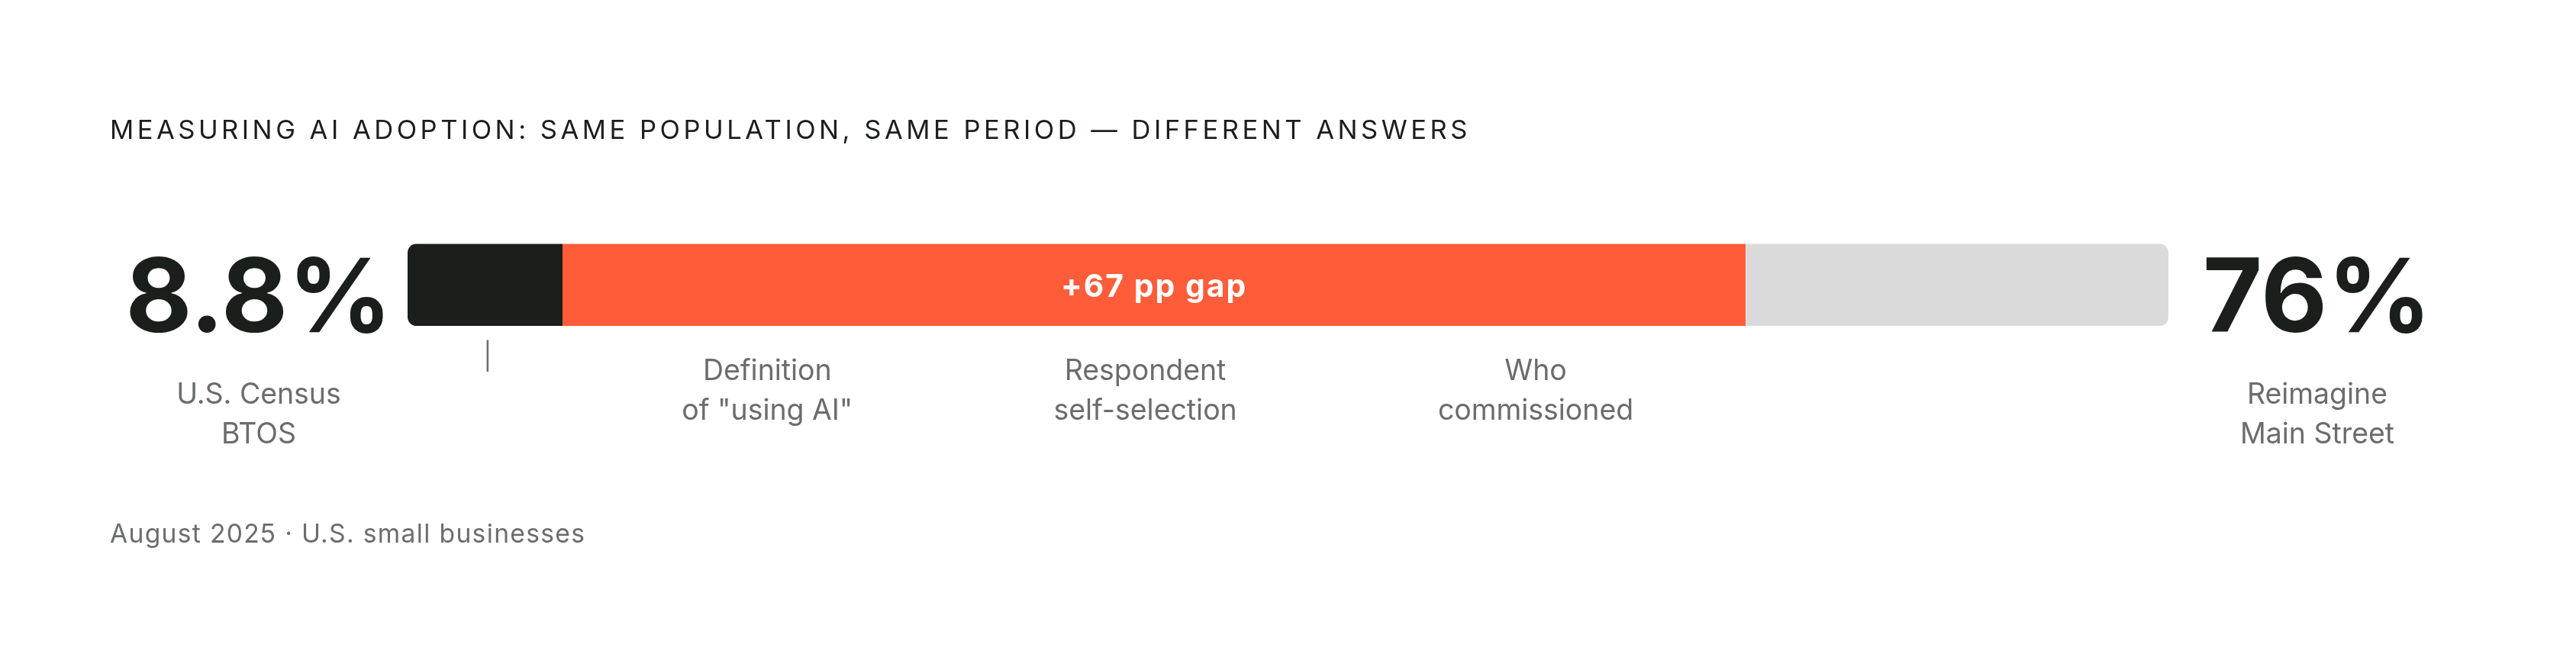
Before cataloguing the sources, one definitional example is worth internalizing because it reframes everything that follows. The U.S. Census Bureau's Business Trends and Outlook Survey recorded 8.8% of small businesses using AI in the production of goods or services as of August 2025. A separate survey by Reimagine Main Street, conducted over roughly the same period, found 76% of SMBs actively using or exploring AI. Same underlying population. Same approximate window. The gap is the product of three variables: what behavior was defined as "using AI," who responded to the survey, and who commissioned it. Keep those three variables in mind as you read every source below.
Government Sources: Most Rigorous, Most Likely to Describe Last Year's Market
The U.S. Census Bureau, the SBA Office of Advocacy, and the Bureau of Labor Statistics collectively represent the most methodologically defensible data available, and they are almost certainly describing a market that has already moved.
The Census Bureau's BTOS uses probability sampling: respondents are drawn in a way that is mathematically representative of the population, not self-selected. The SBA Office of Advocacy synthesizes Census and BLS data into SMB-specific reports, making it the most useful single portal for longitudinal trend lines on firm counts, employment, and sector composition. The BLS handles workforce data: compensation benchmarks, tenure patterns, labor market structure.
Use government sources to establish structural baselines and growth-rate comparisons over time, not for tracking whether your competitors adopted a technology tool last quarter.
Trade Associations: Sector Depth With an Incentive Structure Attached
The U.S. Chamber of Commerce tracked AI usage among SMBs climbing from 23% in 2023 to 40% in 2024 to 58% in 2025, which the Chamber itself described as the fastest technology uptake it had recorded since social media. The Small Business and Entrepreneurship Council's October 2025 survey found 55% of respondents planned to increase AI spending, with another 35% planning to hold steady.
The direction is unambiguous. But trade association membership skews toward larger, more sophisticated firms within whatever "small business" category the survey uses, so headline figures will generally overstate adoption relative to the full SMB population. The granular member-segment breakdowns are often the most actionable outputs.
Industry-vertical associations covering sectors like freight, insurance, and accounting are underused and underreported in the general business press. If one covers your sector, it is frequently the most practically relevant benchmark available.
Vendor and Platform Surveys: The Fastest Data, the Least Generalizable
Salesforce, Thryv, and Business.com publish research with faster publication cycles and larger nominal sample sizes than most government or association surveys. The limitation is structural: respondents are already customers of, or at minimum familiar with, these platforms. That is not a random draw from the SMB population.
Thryv's 2025 survey found 55% overall AI usage, rising to 68% among firms with 10 to 100 employees. That sub-segment finding is the useful number. It tells you something specific about a cohort's behavior, which is more actionable than a headline figure aggregated across firm sizes. Business.com's 2026 Small Business AI Outlook Report surveyed 1,009 U.S. workers at companies under 250 employees and disclosed its methodology, which makes it usable, within limits.
Use vendor surveys for directional signals and sub-segment behavioral patterns. Treat them as directional signals only.
Management Consultancy Research: Useful Framing, Opaque Sampling
McKinsey and BCG produce high-production-value reports that set the strategic vocabulary for entire industries. The limitation relevant to SMB owners: their definition of "small business" frequently means mid-market, and sample composition is rarely disclosed in ways that let you verify whether the findings describe a Main Street retailer or a company with 500 employees and a dedicated IT department.
Use consultancy research to identify strategic themes and understand what larger organizations are prioritizing. Translate cautiously.
Academic and Intergovernmental Sources: Slow, Transparent, Worth the Wait
OECD cross-country SME research is useful specifically for benchmarking U.S. trends against comparable economies, a context that is almost never available from domestic-only sources. University research centers move slowly but tend to be transparent about their methods, which means their findings are easier to stress-test.
How to Read a Statistic Before You Use It: The Four Questions That Filter Signal From Noise
What Exact Behavior Was Measured?
Production-line AI deployment, any business function use, active exploration, and planning to use are all real data points. None of them is interchangeable. A practical test: substitute the definition into the claim and ask whether the statistic still makes sense in context. If it doesn't, the figures are not comparable, regardless of how similar their source descriptions sound.
Who Responded, and How Were They Recruited?
A probability sample drawn by a federal agency and an opt-in panel of vendor customers are epistemologically different objects. Both can be useful; neither should be read as the other. The Thryv sub-segment finding, that adoption among firms with 10 to 100 employees runs well above the survey's headline average, illustrates why sub-segment reporting is often more trustworthy than top-line figures. If your firm falls into a specific cohort, find the cut that matches.
When Was It Fielded?
The BTOS recorded AI adoption jumping from 6.3% to 8.8% over approximately 18 months. That rate of change means data from a year and a half ago already describes a market that no longer exists. For fast-moving technology questions, weight recency heavily. For structural questions like cost structures or workforce composition, older longitudinal data is often more reliable because the underlying signal is less volatile.
Who Commissioned It, and What Would Flatter Them?
This is a bias-awareness filter, which is a materially different thing from cynicism. Vendor-commissioned research is not automatically wrong, but its incentive structure should inform how aggressively you discount it. BCG's 2025 counter-finding, recording a median AI ROI of only 10% with one-third of organizations reporting limited or no gains, carries extra credibility specifically because it cuts against the optimistic narrative surrounding most AI vendor research. A finding that disadvantages the researcher's typical framing is one that earned its place.
The Divergence Between Optimistic and Skeptical AI ROI Data, and What It's Actually Telling You
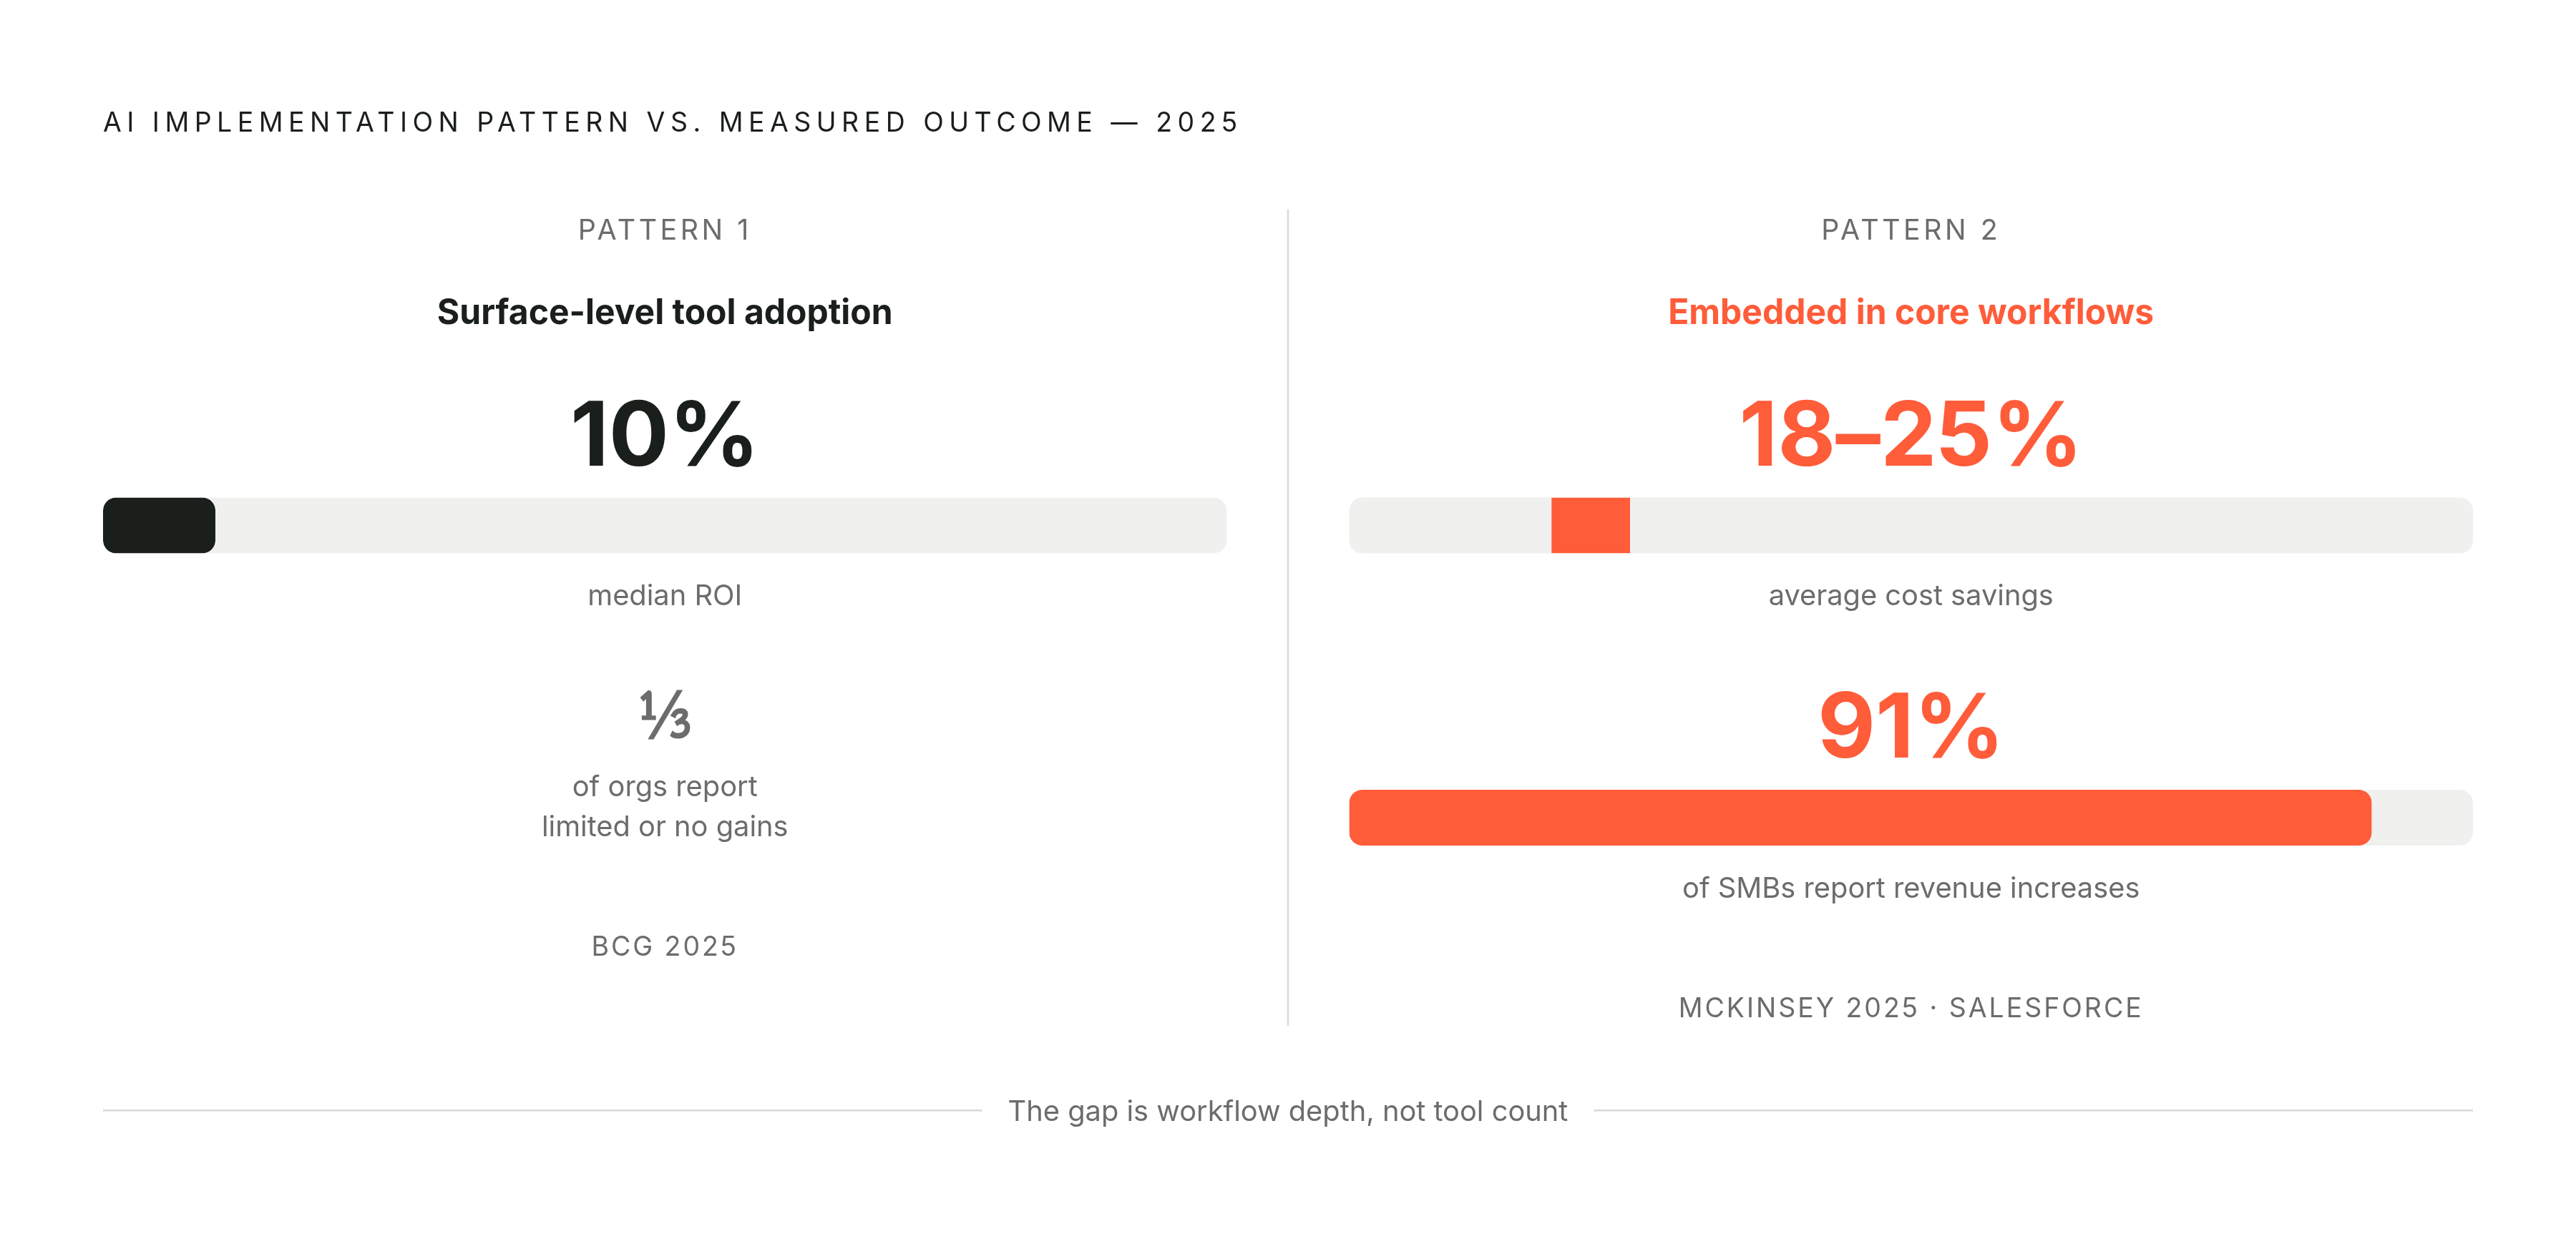
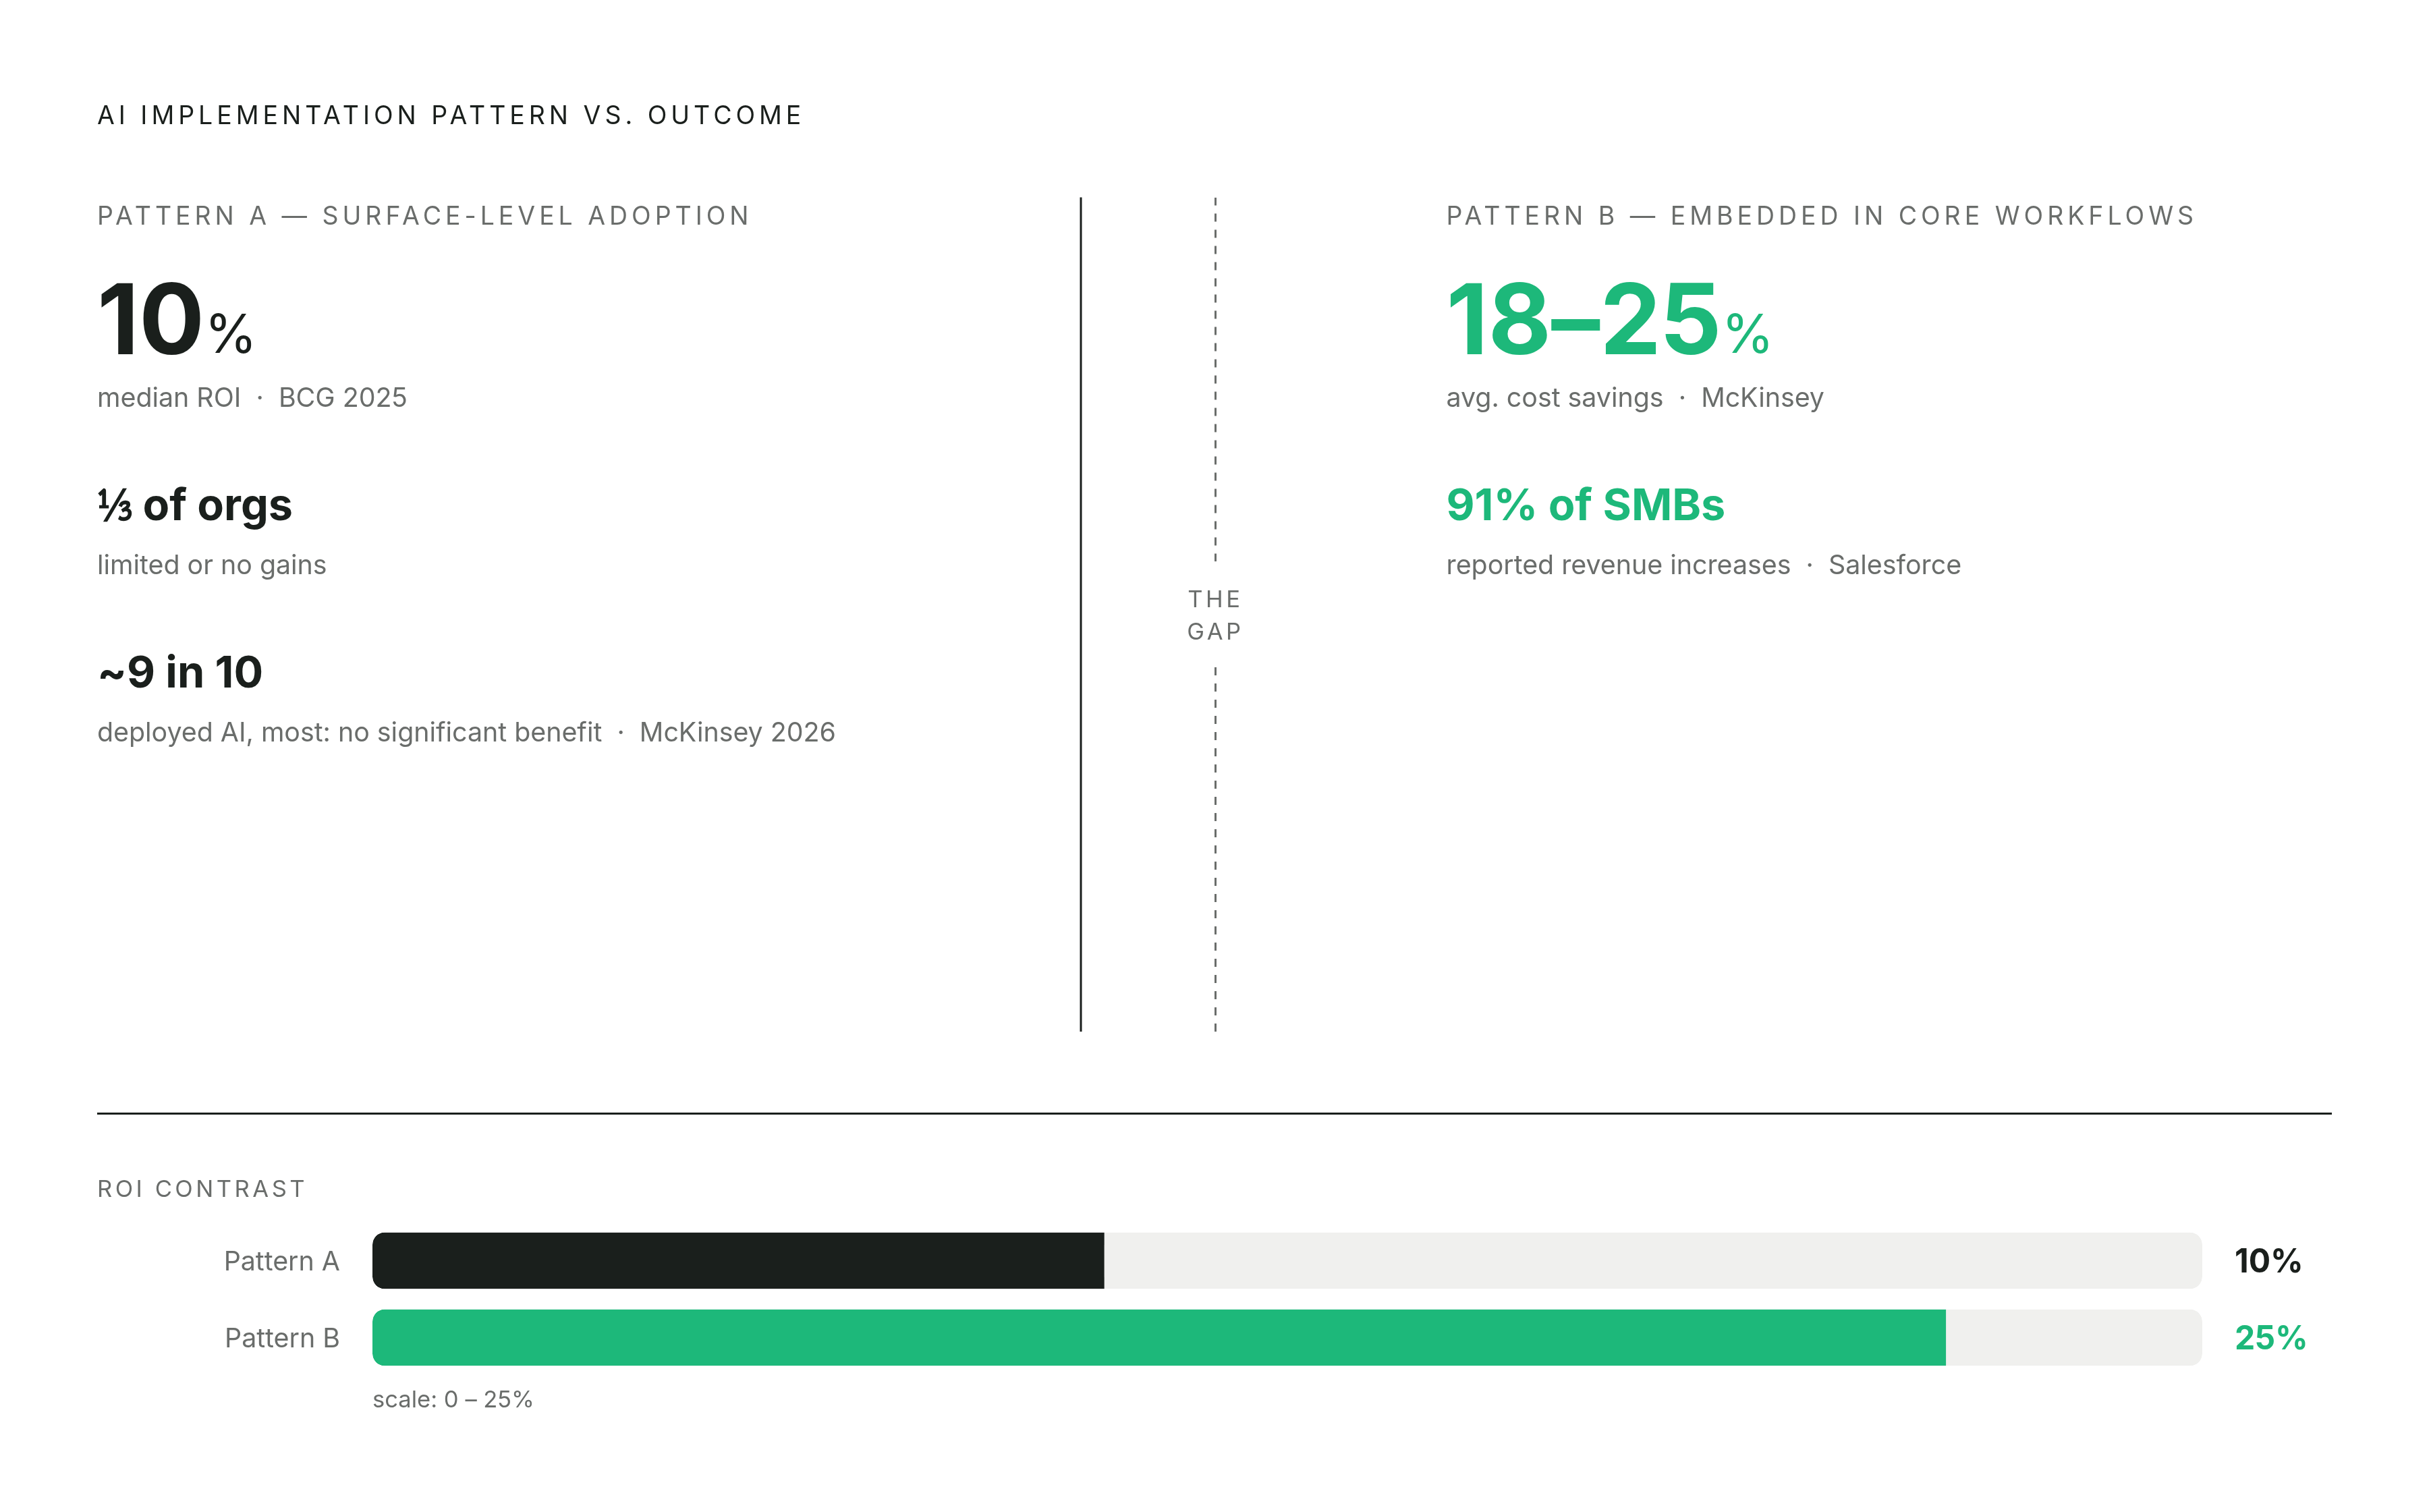
Salesforce's 2025 SMB Trends Report found 91% of SMBs using AI reported revenue increases. BCG's 2025 survey found a median ROI of only 10%, with one-third of leaders reporting limited or no gains. Both come from credible researchers. Both accurately describe their respective populations. They are measuring two distinct implementation patterns.
The McKinsey 2025 finding is where the reconciliation lives: small businesses integrating AI into core workflows reported cost savings averaging 18 to 25%. The operative phrase is "core workflows," meaning AI embedded in how work actually gets done, not tools bolted on top of existing processes. Business.com's survey of 1,009 workers found an average time savings of 5.6 hours per week, but the distribution matters as much as the average: managers saved 7.2 hours; individual contributors saved 3.4. The aggregate obscures the mechanism.
BCG's median of 10% ROI likely describes the other pattern. A separate McKinsey study from April 2026 found that nearly nine in ten companies had deployed AI in at least one business function, yet the vast majority reported no significant benefit. The explanation is that distributing tool subscriptions is a different act from rethinking how work gets done. You can hand every cook in the kitchen a new knife, but if the recipe is broken, dinner is still ruined.
The data requires you to ask the right question. Tool adoption without workflow redesign produces BCG's median. AI embedded in the actual operational bottleneck produces Salesforce's 91% and McKinsey's 18 to 25% cost savings. For an SMB owner, the research question is "which of these two patterns describes what we're actually building."
This distinction changes how you evaluate any ROI statistic going forward. Ask whether the study measured implementation type as well as tool adoption. If it didn't, its aggregate figures tell you almost nothing about what your organization should expect.
Triangulating Across Sources to Reach a Defensible Position on Any Market Question
Why a Single Source Is Always Insufficient
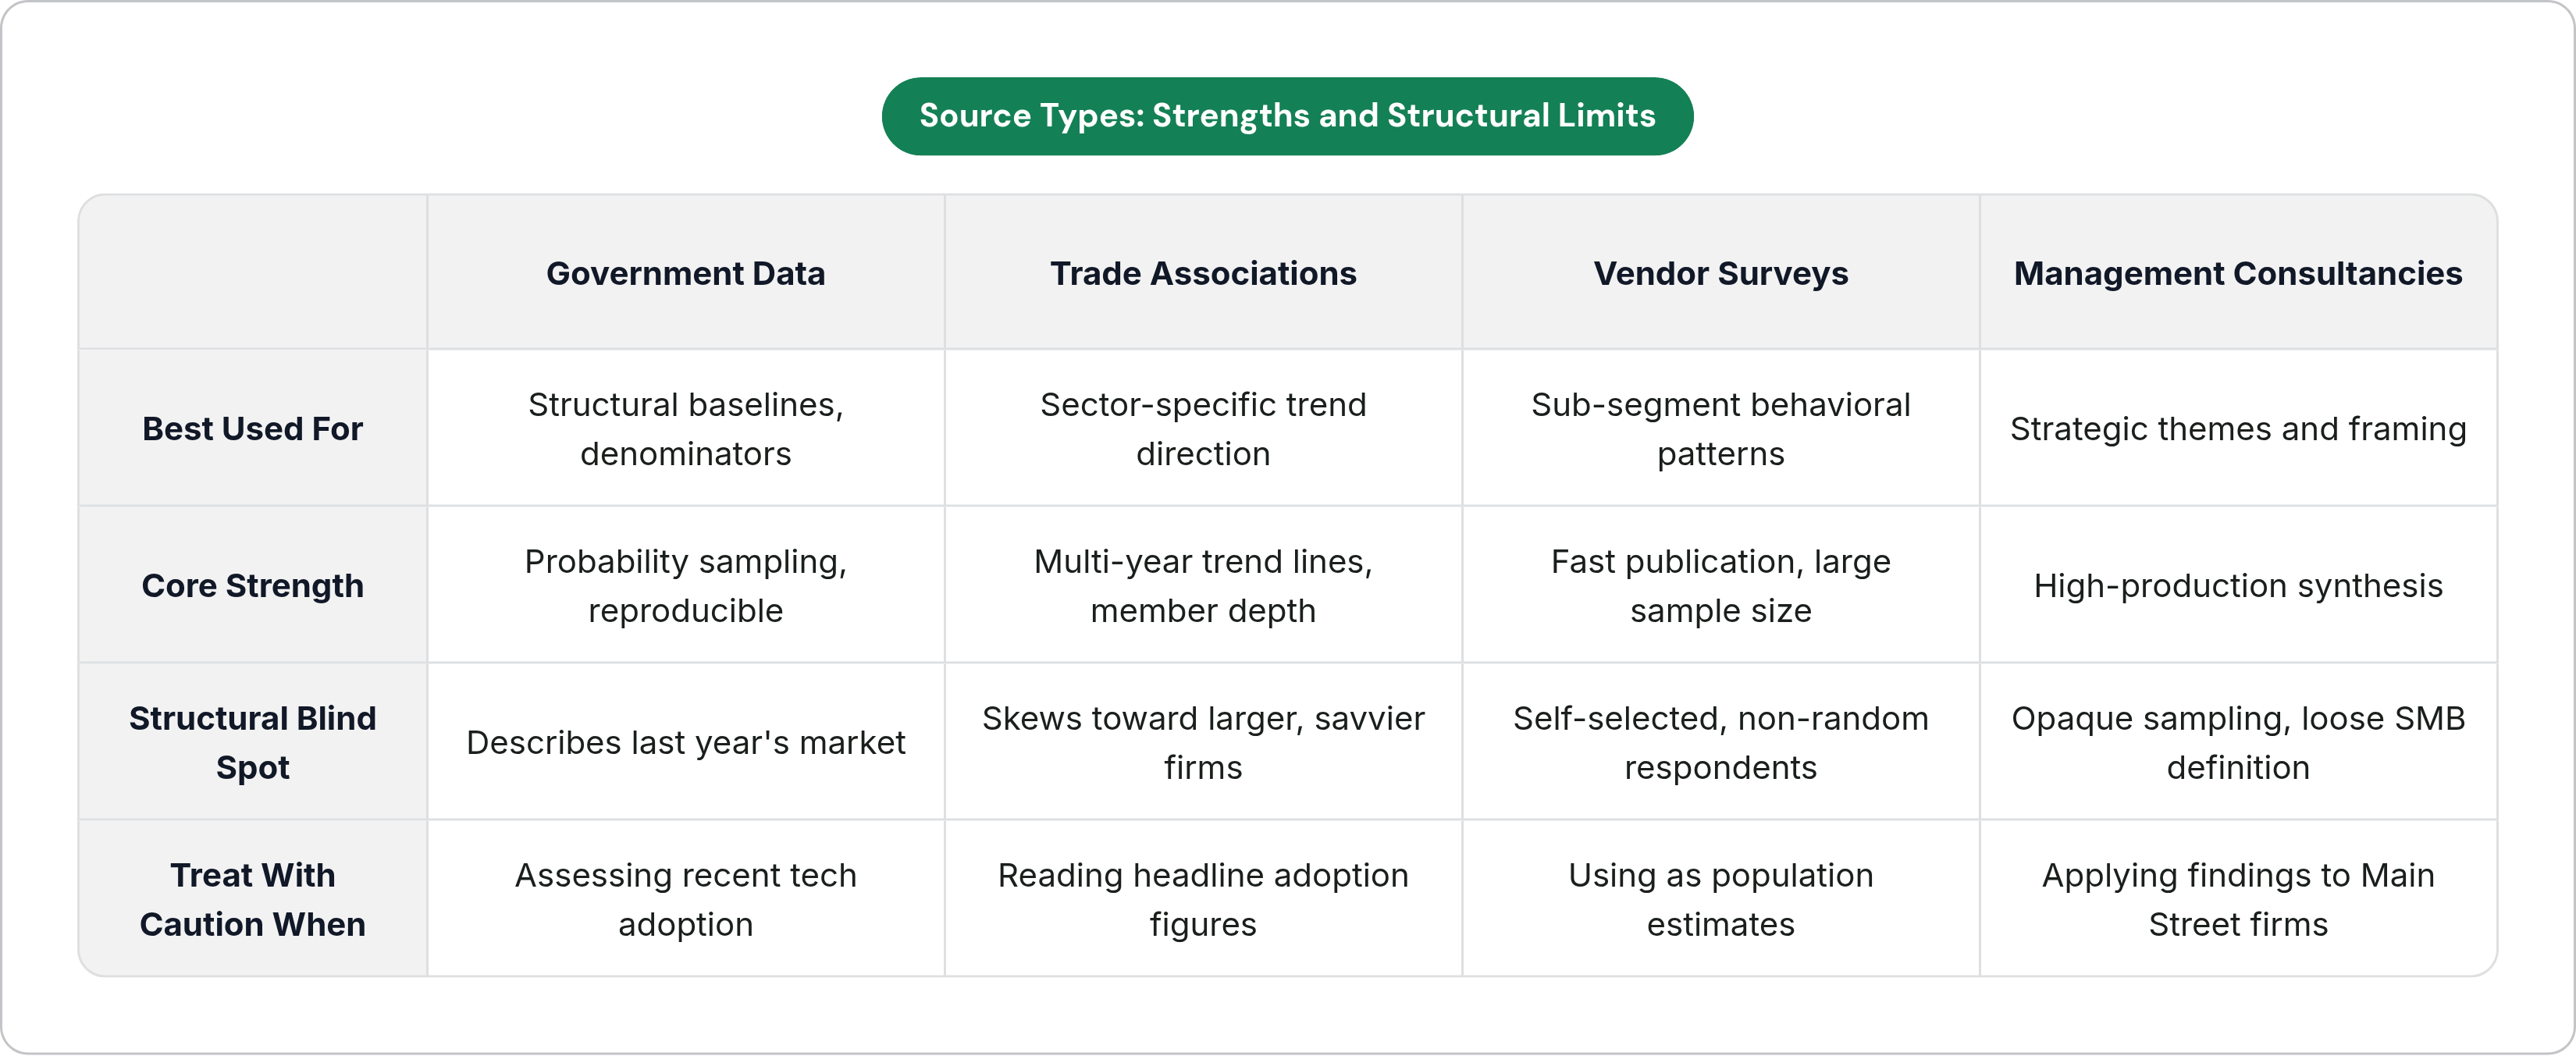
Every source type has a structural blind spot. Government data is slow. Vendor data is distorted by self-selection. Consultancy data obscures SMB-specific definitions. The goal of triangulation is to identify what remains stable across sources and what shifts with methodology. Stability across independent methods is the closest thing available to a verifiable finding.
A Three-Layer Approach
Layer 1: Establish the structural baseline. Start with Census or BLS data for the population-level fact unlikely to be contested: firm counts, compensation ranges, workforce composition. These figures won't illuminate AI adoption speed, but they give you the denominator that contextualizes everything else.
Layer 2: Add directional signals. Layer in trade association and consultancy data for trend direction and strategic framing. Note where they converge with the baseline and where they diverge. The Chamber's three-year adoption trajectory, 23% to 40% to 58%, is consistent enough across multiple reports that the trend itself is credible even if any single year's figure carries a margin of error.
Layer 3: Test with vendor data. Use platform and vendor surveys for sub-segment behavior and adoption patterns. Treat them as hypotheses to test against layers one and two, not as conclusions. If a vendor survey's sub-segment finding is consistent with the directional trend from layer two and plausible given the structural baseline from layer one, it becomes usable, with explicit caveats attached.
A Worked Example: Time Savings From AI Implementation
The government layer offers no direct time-savings data, but BLS wage figures let you assign a dollar value to hours saved, which converts a time estimate into a financial projection.
The trade association and consultancy layer provides the mechanism. The Chamber's adoption trajectory confirms the trend is real and accelerating. McKinsey's core-workflow finding explains why some implementations produce savings and others do not.
The vendor layer gives you a ballpark. Business.com's survey of roughly a thousand respondents found an average of 5.6 hours saved per week. That figure should be discounted toward the conservative end for a first implementation, given the selection bias of the sample and the persistent gap between reported and realized savings in early deployments.
The defensible position after triangulating: meaningful time savings follow from embedding AI in the right workflow; the vendor survey range gives you a plausible upper bound for favorable implementations, with no guarantee it represents a baseline. That is a sentence you can defend in front of a skeptical CFO because you can show your work.
Where the Implementation Gap Changes the Research Question Itself
The spread between BCG's 10% median ROI and McKinsey's 18 to 25% cost-savings figure for core-workflow implementations is the measurable gap between two distinct approaches to AI deployment. That gap has produced a corresponding market response: embedded AI specialists who diagnose operational bottlenecks and build around them are in demonstrably higher demand, with LinkedIn data showing relevant role growth increasing 42-fold between 2023 and 2025. Consultancies that build and deploy custom AI systems inside small and mid-sized businesses have emerged specifically to close that implementation gap rather than sell tool access. AWS alone committed one billion dollars to forward-deployed engineering capacity, a resource allocation that reflects what the ROI data is already showing.
The pattern is consistent enough to constitute a finding: if the favorable data reliably describes deep workflow integration and the unfavorable data reliably describes surface-level tool adoption, then the model that prioritizes the former is the one aligned with what the research actually shows.
Two Practical Habits Worth Keeping
First, when a statistic will inform an actual decision, record its source type, sample description, and field date alongside the figure, not just the number itself. A statistic gains its meaning from its provenance.
Second, when two credible sources disagree substantially, treat the disagreement as the finding. Substantial divergence between independent, methodologically sound sources almost always reveals something real about variation in outcomes across different populations or approaches, and that variation is usually more informative than either number alone.