Survey Design Mistakes That Make SMB Customer Research Useless
Flawed wording, order, and scale design make SMB surveys misleading instead of useful.

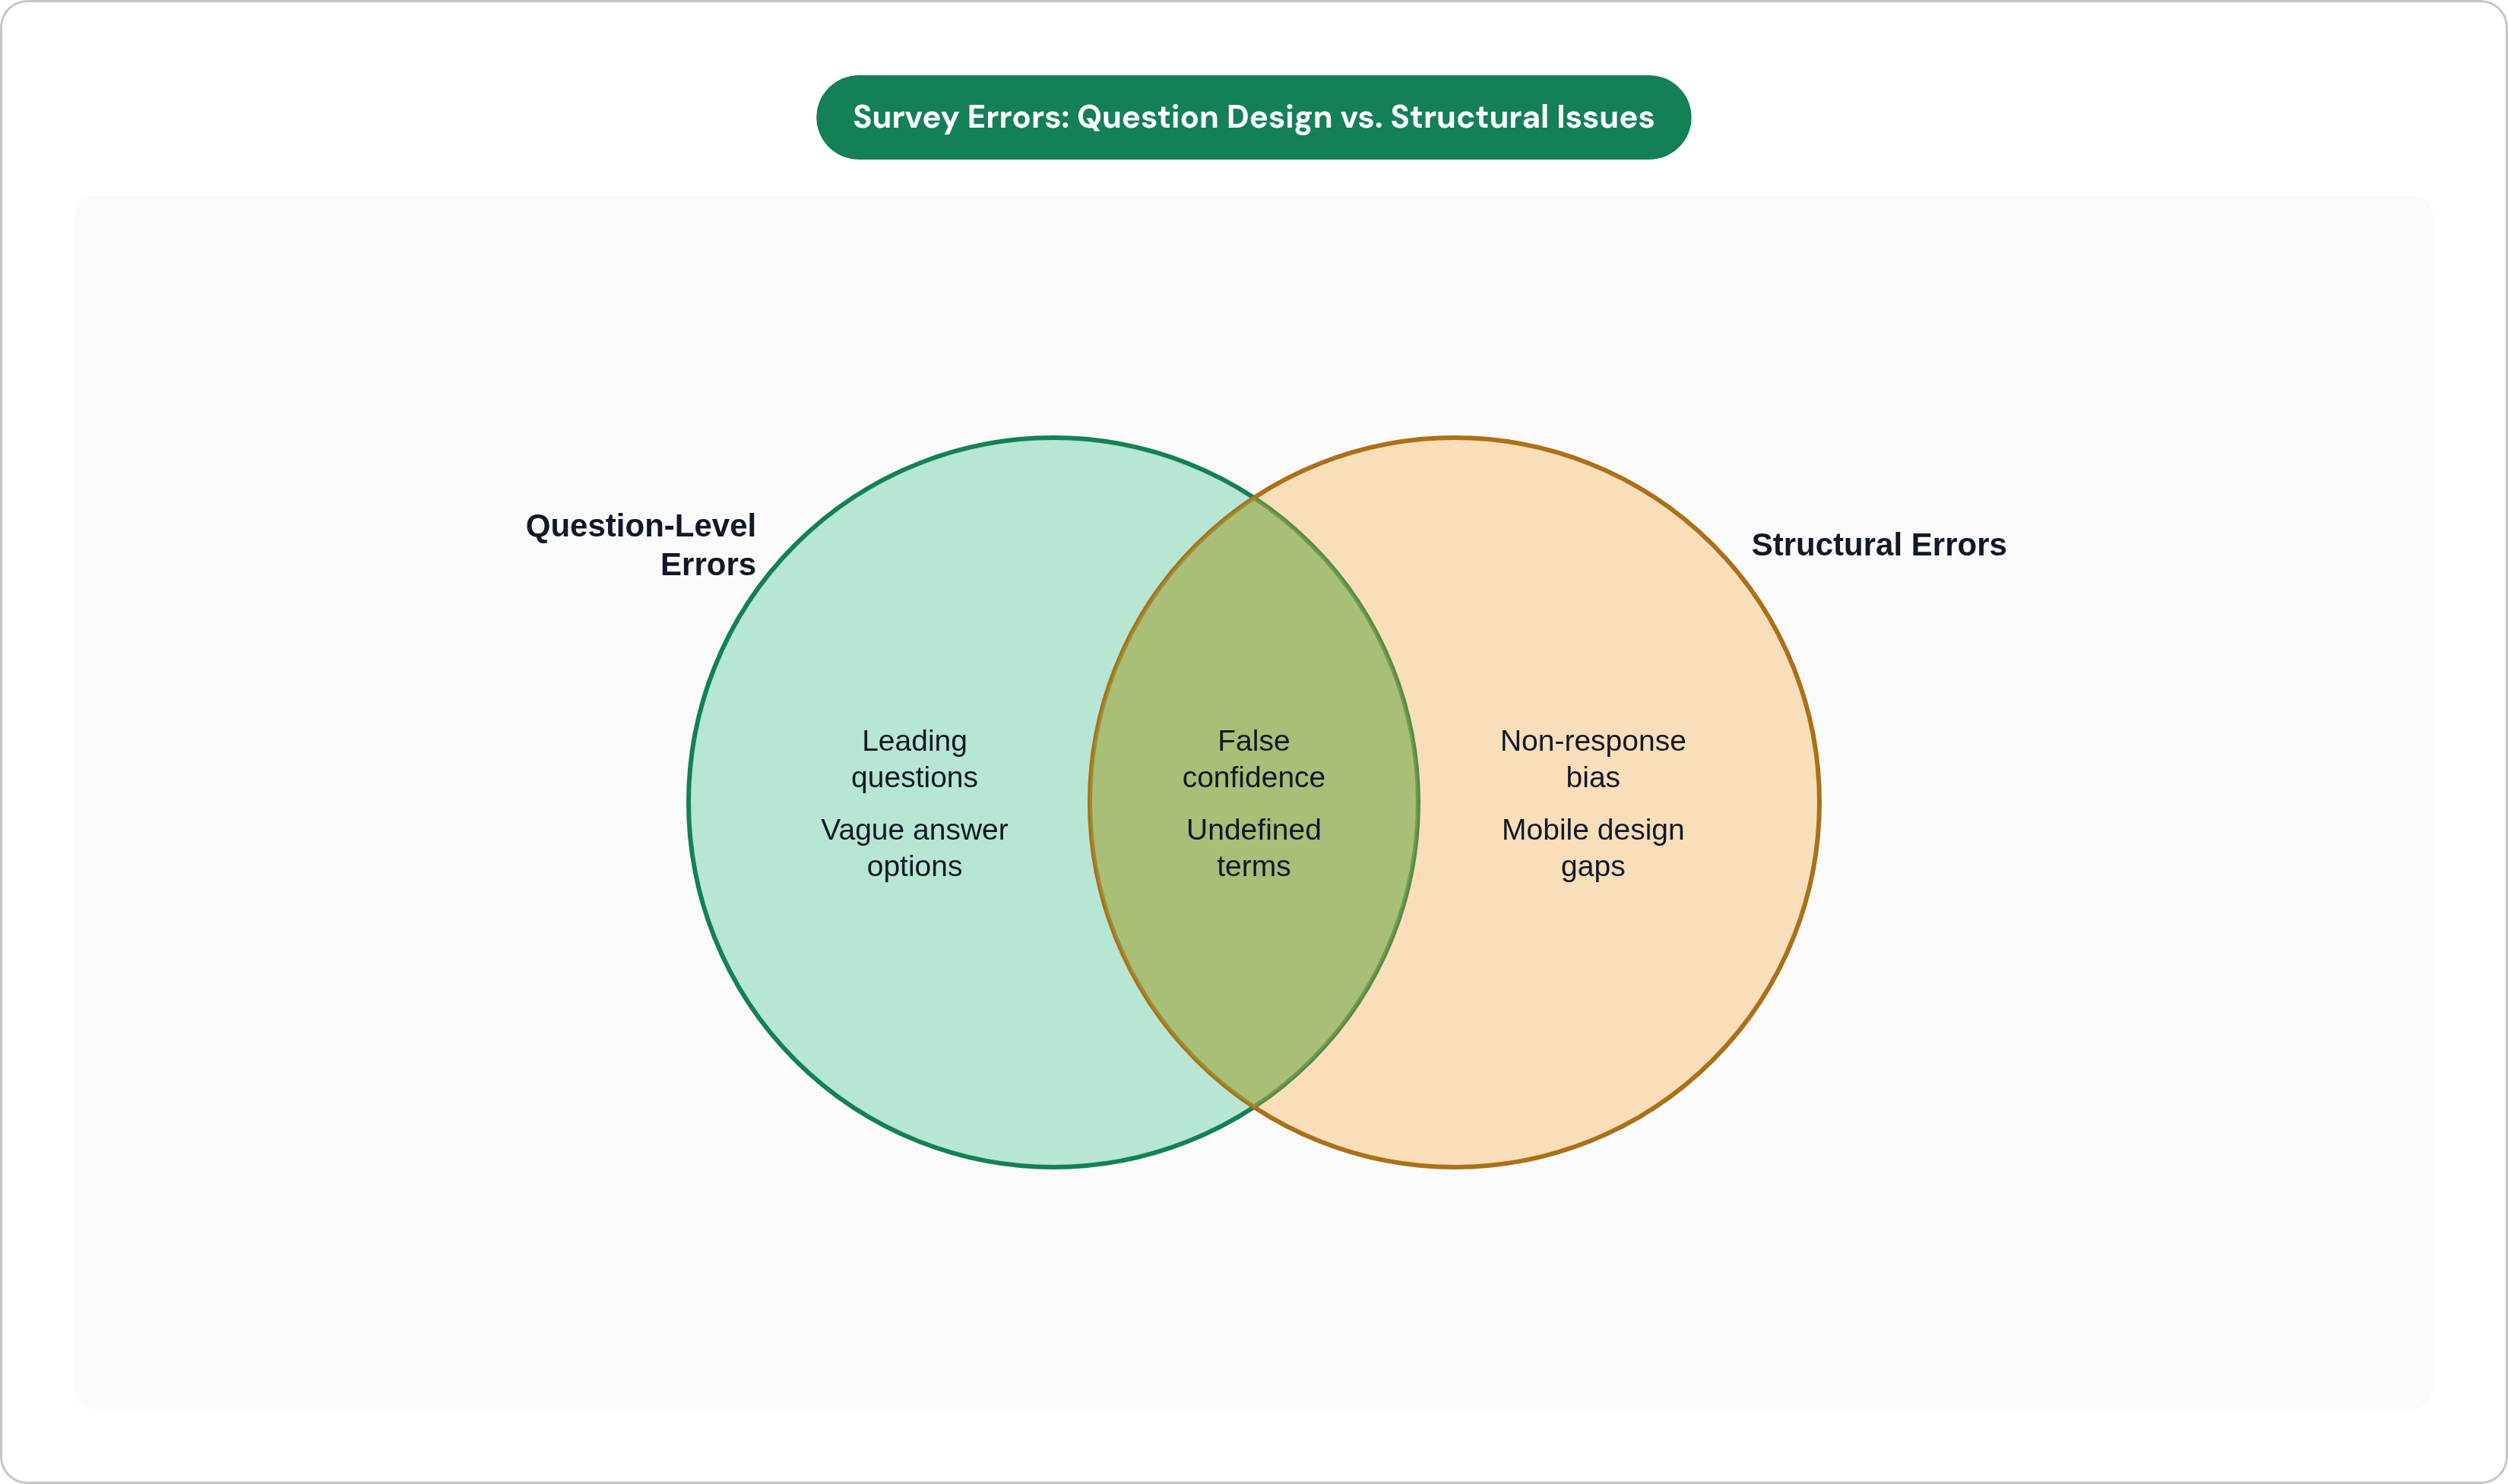
Most SMB owners who send out a customer survey put real thought into it. Subject line, a nice round number of questions, maybe a coupon for finishing. Then the data comes back and it's garbage, and nobody was lazy. The corruption happened upstream: in the wording, the order, the answer choices, long before anyone clicked "start." A leading question or a double-barreled item produces confident, clean-looking data that's wrong, which is worse, because SMBs make real calls off these numbers. Pricing changes, service cuts, headcount decisions, all resting on a foundation nobody stress-tested, and an SMB doesn't get the do-over a Fortune 500 research team gets. It gets one shot and one intern with a Google Forms account.
How leading questions corrupt the answer before it's given
A leading question hands the respondent the answer and asks them to nod along. "How satisfied were you with our helpful and knowledgeable staff?" measures only whether the customer felt like arguing with the premise, and most people, staring down a form with limited patience, don't bother.
The fix is boring on purpose: strip the adjectives. "On a scale of 1 to 5, how would you rate your interaction with our staff?" leaves room for the customer to say the staff was rude, distracted, or fine, whatever actually happened. Watch for the quieter version too. A "fast turnaround" or "convenient location" tucked mid-sentence does the same priming work, just with less obvious fingerprints.
The mistake is almost always well-intentioned. Whoever wrote the survey works at the business, believes in the staff, believes in the turnaround time, and that belief leaks straight into the phrasing without anyone noticing. A survey stuffed with leading questions measures how much implied pressure a customer can resist on a Tuesday afternoon. Not much, it turns out.
Double-barreled questions and the single score that hides two different answers
A double-barreled question asks about two things and demands one answer. It's like asking someone to rate a marriage and a mortgage on the same five-point scale. "How satisfied are you with the product's quality and pricing?" assumes a customer can't love the build and hate the invoice, which is exactly the split plenty of customers live in.
Here's the version that cost real money. A product team once asked customers to rate satisfaction with "the new features released last quarter," ten features folded into one question. One of the ten had failed hard: usage down 70%. The rest performed fine. The blended score came back near-neutral, unremarkable, filed away and forgotten. Nobody caught the failing feature through the survey. Usage logs surfaced it weeks later, after the damage had compounded. The survey actively smoothed the problem over.
One construct per question, no exceptions. Split quality from pricing. Split ten features into ten questions, or at minimum a short list respondents rate individually. Before fielding anything, read each question and ask whether a respondent could reasonably feel differently about each half. If yes, that's two questions wearing a trench coat. A clean aggregate score is more dangerous than a messy one, handing you false confidence where a messy one would prompt honest doubt.
Question order effects that change what customers think they're answering
Order carries real weight. Whatever question lands first sets a frame, and that frame colors everything after it, whether the respondent notices or not. Ask "How likely are you to recommend us?" right after a question about a recent complaint, and the NPS score reflects the complaint's freshness, not the relationship's actual shape.
Flip it and you get the mirror problem. Lead with overall satisfaction, and customers anchor on the general good feeling before they've been prompted to recall the billing error two questions later. Their satisfaction score comes back inflated, padded by a positivity nobody asked them to reconsider yet.
General to specific, never the reverse; that's the whole rule. A billing-mistake question should never sit upstream of a brand-trust question. Map the sequence on paper before building anything, label what each question actually probes, and check whether anything downstream gets contaminated by what came before it. Demographics belong at the end, too, not the start. Ask someone their company size or revenue bracket first, and you've primed them to answer as a spokesperson for their category instead of as themselves.
Unclear answer options that force respondents to guess what you mean
Sometimes the question is fine and the answer choices are the problem. Overlapping ranges are the classic error: "1 to 10 employees," "10 to 50 employees," "50 to 100 employees." A business with exactly 10 employees now has two valid boxes, and whichever one they pick is basically a coin flip landing in your dataset dressed up as signal.
Missing an "N/A" or "I don't know" option does similar damage more quietly. Respondents with no real opinion get forced into the least-wrong answer, and that manufactured opinion sits in your spreadsheet looking identical to a genuine one. Vague frequency words compound it. "Often," "sometimes," "rarely" mean wildly different things depending on who's reading them; one person's "often" is another's "once in a blue moon." Swap the adjectives for actual intervals: more than once a week, once a month or less.
Unbalanced scales are the last trap, and they're sneaky because they look generous. "Excellent / Very Good / Good / Poor" gives three ways to say yes and one way to say no, tilting the whole distribution before a single customer weighs in. Write the answer options before finalizing the question, not after. If the options don't fit cleanly, that's usually the question's fault, not something a patch job on the choices can fix.
Non-response bias and why the customers who don't reply are the ones you most need to hear from
Surveys have a magnet problem. They pull in the furious and the delighted, while the quiet majority living out an ordinary experience opts out entirely. That's not a rounding error. It's a structural skew, and it means your data leans hard toward the emotional extremes by design, not by accident.
Response rates back this up. Per Survicate's benchmarks, most customer and product experience surveys land in the 5 to 10% range, median around 9.98%. Send 200 invitations at that rate and you're looking at 10 to 20 usable responses, nowhere near enough to segment by customer type, tenure, or spend without the numbers dissolving into noise. Statistical validity asks for more than most SMBs realize: a sample of 1,000 customers needs 285 completed responses for 95% confidence at a plus-or-minus 5% margin, a 28.5% response rate, inside the 20 to 30% range considered the benchmark for programs actually run well.
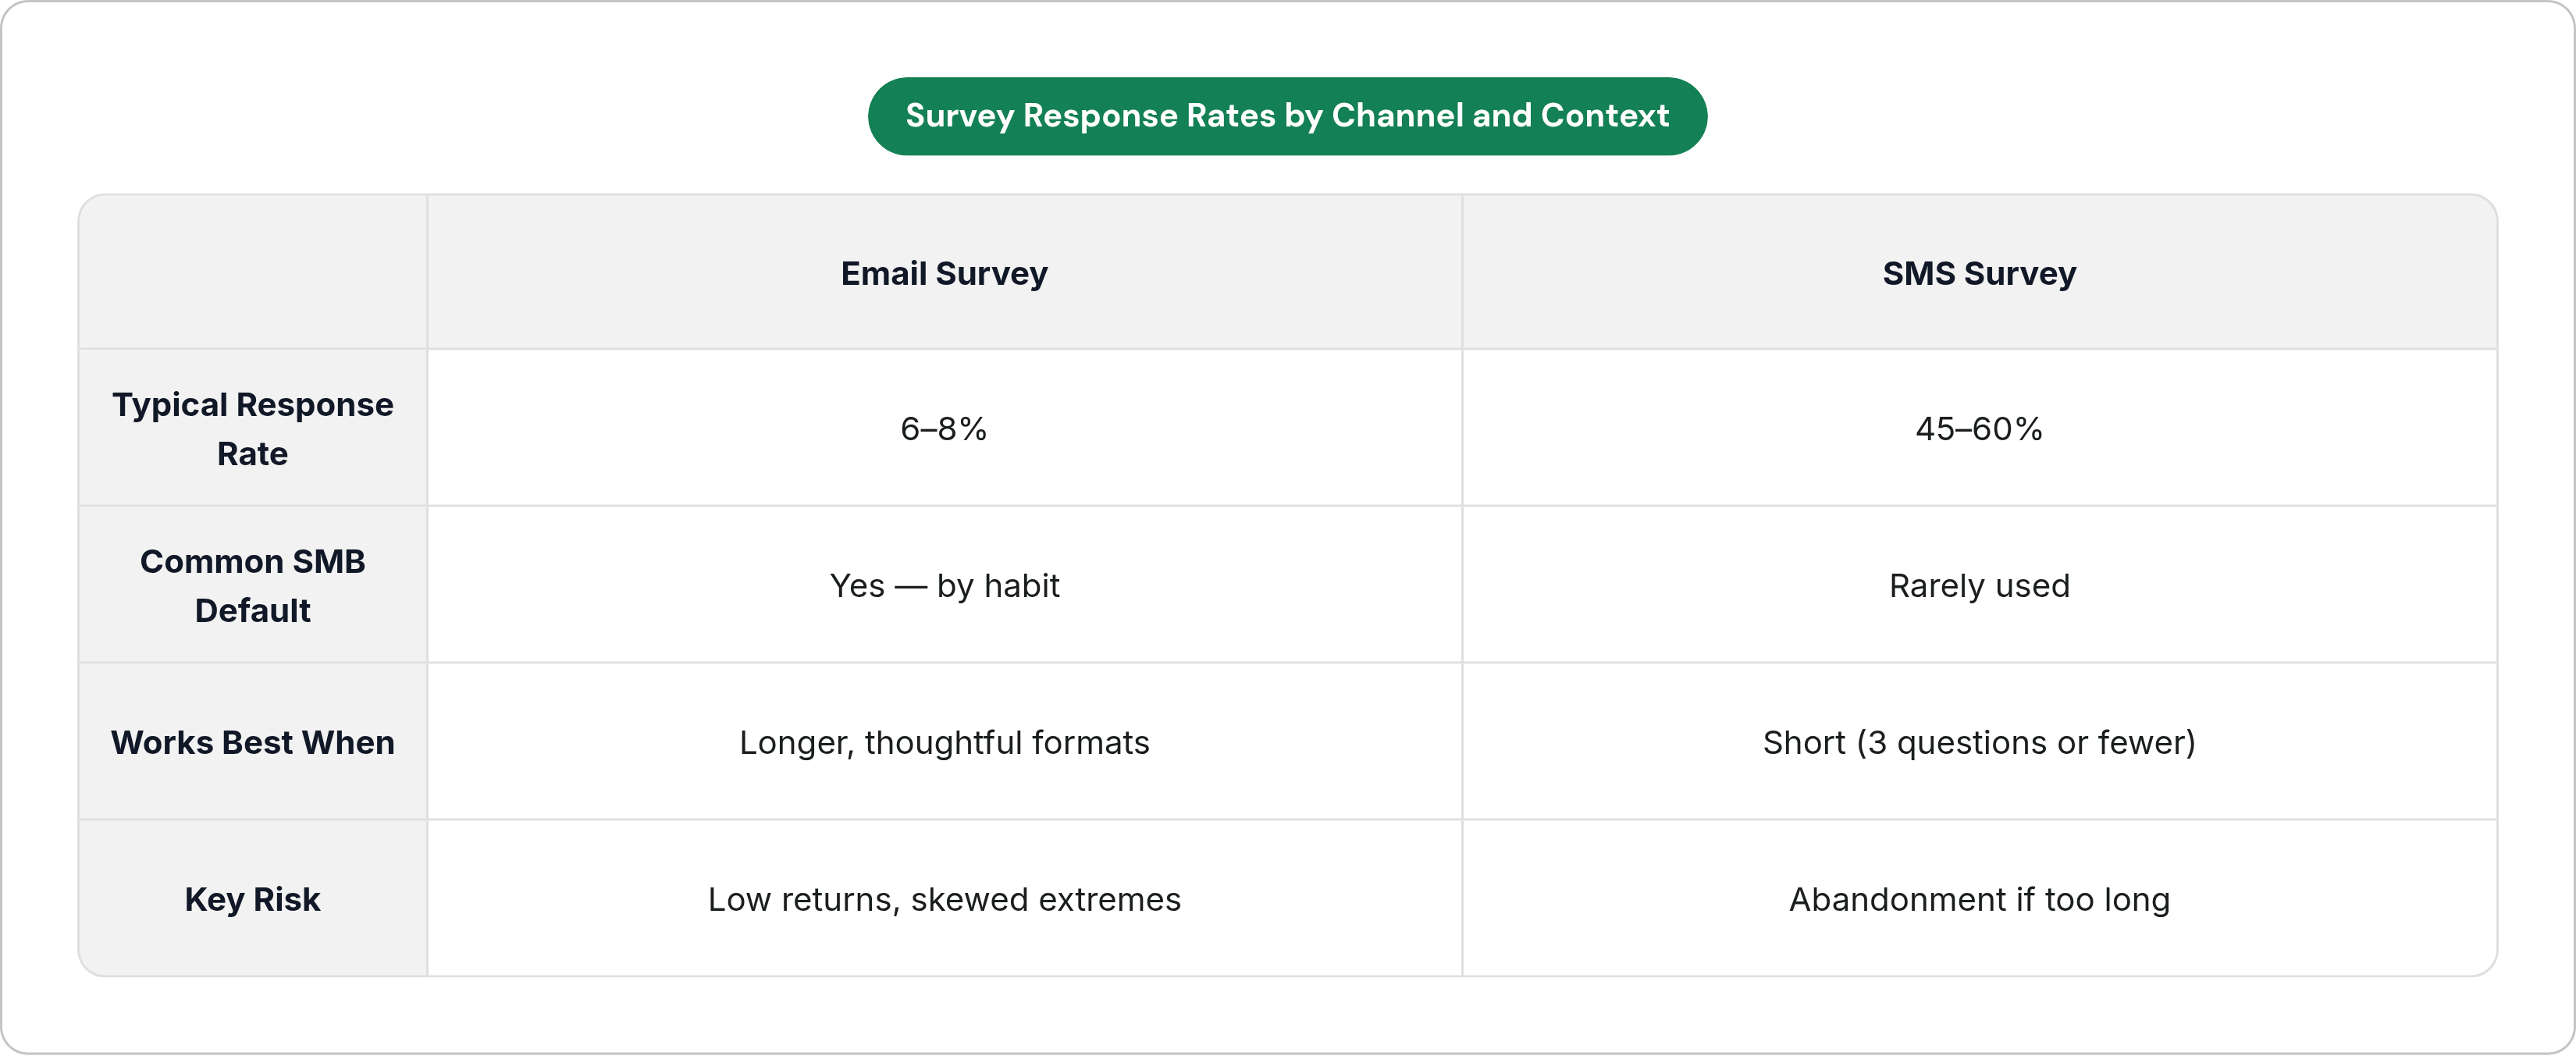
Channel choice makes this worse before it makes it better. Email surveys typically return 6 to 8%. SMS surveys, per the 2025 Mobile Engagement Report, return 45 to 60%. Most SMBs default to the long email survey anyway, out of habit more than strategy. Shortening the survey comes first; then match the channel to that shorter length and to wherever the audience actually lives. A 3-question SMS survey beats a 15-question email survey on every measure that matters. Whoever isn't answering shapes your decisions just as much as whoever is; naming that gap out loud is half the job.
Designing surveys on desktop when most respondents are on a phone
Per Merren's research, over 60% of survey responses now come from mobile devices. Most surveys still get built and proofed exclusively on a desktop monitor, meaning the majority of respondents experience a product nobody actually tested.
Ranking matrices, wide scale tables, multi-column layouts, all of it renders fine on a 27-inch screen and turns into an unreadable mess on a phone. Customers hit that wall and bail, and the ones who stick around to finish skew toward desktop users, a systematically different population than the one you meant to survey. For SMBs specifically, this cuts against exactly the people they most want to hear from: owners, field staff, buyers making decisions between calls, all disproportionately on mobile and disproportionately the ones dropping off mid-survey.
Build for the phone first. Test on at least two actual phone models before fielding anything. Replace matrix grids with single-question screens that move one at a time, and keep any open-text box optional and short. The abandonment stays hidden in your results tab, which is exactly what makes it easy to miss and expensive once you notice.
Survey length and scope creep that turns focused research into noise
For a lot of SMBs, the survey is the only formal moment they get with a customer all year, so it quietly turns into a dumping ground for every question anyone on the team has ever wanted answered. Marketing wants a brand question. Ops wants a service question. The founder wants to know if people would pay more for a subscription tier that doesn't exist yet.
Respondents notice. They rush the back half, start picking answers at random, or close the tab, and everything from roughly question eight onward becomes statistically worthless. Fatigue sets in even faster on mobile, the same audience already fighting a bad layout, so a survey that's merely too long on desktop becomes a lost cause on a phone.
Decide the one decision the survey needs to inform before writing a single question. Every question that doesn't serve that decision is quietly taxing the ones that do. For transactional customer surveys, fewer questions with one clear topic beat longer multi-topic instruments on completion and usability, consistently. Draft the chart or table you expect to produce before writing anything else, then work backward to the minimum set of questions that fills it. Whatever's left over gets cut, or saved for a second survey nobody's forcing into this one.
What "AI use" actually means and why surveys that don't define it produce irreconcilable numbers
Published figures on SMB AI adoption range from under 10% to nearly 60%, and that gap stems entirely from surveys measuring different things under the same three-letter label. Government data using stricter production-use definitions, meaning AI actually embedded in a real workflow, puts adoption around 17 to 20%. The SBA's most conservative production-use figure comes in at 8.8%. Vendor surveys counting any experimentation or one-off trial climb as high as 58%.
That's a double-barreled question running at the category level. Someone who tried a chatbot once and someone who replaced a full hiring cycle with an AI system both check the same "yes, we use AI" box, and the resulting number tells you nothing comparable to anything else, anywhere.
This matters directly for SMBs writing their own customer research. Ask "Do you use AI in your operations?" without specifying what counts, and the answers will differ from each other and diverge from any outside benchmark. Define the term inside the question itself: by AI tools, we mean software that automates a recurring task in your workflow, not a one-time experiment or a personal assistant app. Hold that definition steady across every question that touches it. The same discipline applies to any fast-moving or technical concept. An undefined term functions as a double-barreled question wearing a single word's disguise.
The answer options that hide the decision SMB customers are actually making
A binary answer set can quietly erase the answer a respondent would have actually given, and the missing option never shows up as missing. It shows up disguised as a false preference for whichever choice was actually on offer.
SMB surveys on AI adoption often frame the choice as "hire a full-time AI engineer" versus "use off-the-shelf tools," which leaves out a third, increasingly common path: bringing in an outside AI specialist who works inside existing workflows without the business committing to a full-time hire. Leave that option off the list and the data shows a spike toward off-the-shelf tools that reads like a strong market preference. The spike reflects a forced choice with nowhere else to go.
That embedded model is a live, functioning option for SMBs right now: an AI engineer working directly inside the business to get production-ready systems built in weeks instead of months, without the overhead of a full-time salary. It's a pattern scaled down from enterprise practice, AWS's Forward Deployed Engineering approach being one documented example at the larger scale. A survey designer who's never heard of the option can't put it on the list, which is exactly why the research on what's actually available has to happen before the questions get written. List every plausible answer a well-informed respondent might give before drafting the choices. If that list runs past two or three items, the answer set needs to grow with it, or the question needs an open write-in field standing by.
A before-and-after checklist for SMB surveys that produce usable data
Most of what's above stays invisible until you know exactly what you're looking for. A short pre-field review catches it before it ever touches a customer.
On the question level: does any item lean on an evaluative adjective that assumes a good experience already happened? Rewrite it neutral. Is any single question quietly asking about two different things? Split it. Confirm every answer set is mutually exclusive and complete, adding "not applicable" or "other" wherever the list falls short, and flag any frequency word floating without a time reference attached.
On sequence: could an earlier question be priming a later one? Reorder it, or buffer it with something neutral. Confirm demographic questions sit at the end, not the front, and confirm the whole thing moves general to specific without doubling back.
On scope and channel: name the one decision this survey exists to inform. If there isn't one yet, cut questions until there is. Then test the thing on an actual phone screen, not just the laptop it was built on, before it ever reaches a customer's inbox.